
.png)
SaaS companies sit on a lot of data.
The most successful ones know how to identify and apply it to their business strategy. However, the key point here is “identify.” All the data points in the world matter little if you don’t know the right metrics to evaluate them.
Fortunately, you don't have to get lost in the sea of data bytes. Understanding and acting on these metrics can differentiate between becoming a market leader or just another player in the competitive SaaS industry.
This article will help you cut through the noise to focus on the 18 key SaaS metrics that can drive your business toward its ambitious growth goals.
SaaS metrics are benchmarks that companies use to track performance and growth. These growth metrics allow companies to gauge their success, plan for the future, and adjust strategy when needed.
You'll need to evaluate several SaaS metrics to understand your business’ performance clearly. But Meg Gowell, Appcues Director of Growth Marketing, argues retention rate is most important of all.
“Retention rate is not the same as churn rate, but more of a measure of adoption of your product,” she said. “Your retention metric will drive acquisition and growth, so it’s an important place to start.”
Retention can be calculated in multiple ways. An example from Gowell:
"Pinterest’s retention metric is Weekly Active Pinners,” she said.
“They use that to help orient their onboarding, engagement, and revival campaigns. Those campaigns would push a user to pin something (and do it weekly). Knowing your retention rate will also help you define your activation rate, which is another vital metric.”
Some metrics that help you track retention include:
Check out this article for deeper insight into the best retention metrics to track and measure for your Saas company.
Beyond retention, you could use as many as 100 different metrics to analyze the success of your business. But that can get overwhelming quickly. And you might expend time and resources on the wrong ones for your stage.
Let’s explore the most important metrics and put you on the right path to identifying and measuring them in your SaaS company.
In the early days of a SaaS startup, resources are limited, and every decision counts. Focusing on minimum viable metrics ensures these companies prioritize what truly matters, eliminating distractions and optimizing their path to growth. It's all about making informed choices with laser precision.
Customer retention can be shown through many other metrics, but simply put, retention rate looks at the number of customers at the end of a given time frame compared to the number of customers from the same cohort at the beginning of the same time frame.
Retention rate = (# of customers at the end of a given period – number of new customers) ÷ total # of customers at the beginning of that period
Head over to the Pirate Metrics Calculator to crunch some numbers and find which part of your user journey you need to optimize to improve your metrics.
This formula helps you track what percentage of the visitors to your website you get convert into an inbound trial, demo, or any other lead.
Traffic-to-lead ratio = (# of visits ÷ the # of leads generated over the same timeframe) x 100
You might put a lot of effort into marketing to generate traffic to your landing pages, but if that traffic doesn’t turn into leads, it might indicate wasted effort.
Keeping an eye on your website traffic-to-lead ratio shows whether you need to improve your inbound lead generation tactics. However, remember that other elements, like your pricing, affect a “good” ratio (premium products might convert fewer leads).
Customer conversion (or lead-to-customer) rate captures the number of both trailers and other types of leads.
Conversion rate = total # of trial users who signed up for paid subscription ÷ total # of trial users
Your conversion rate indicates how many free trial or freemium subscribers become paying customers. A high conversion rate indicates that users quickly uncovered your product’s value and could easily use its features. It means your onboarding processes worked exactly as intended, guiding users through the sign-up process with the right mix of helpfulness and brevity.
Companies whose conversion rates appear lackluster should scrutinize their onboarding process and scour user behavioral data to see where users tend to fall off. Even the smallest improvements in your conversion rate can significantly improve your revenue over time.
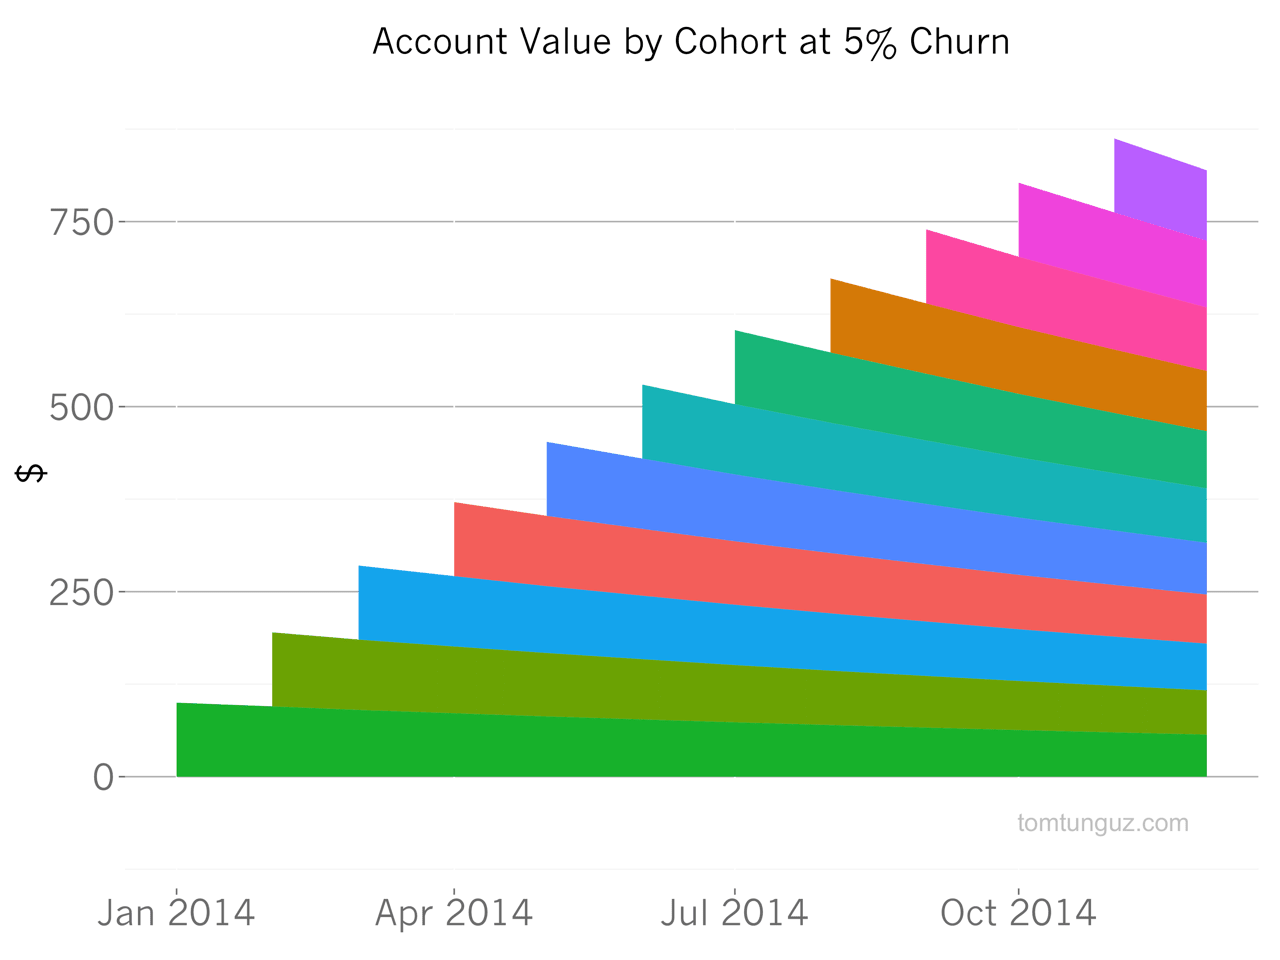
Churn measures the rate of loss for one of two things. Customer churn calculates the number of customers or accounts leaving your service each month as a percentage of your overall customer count.
Revenue churn identifies the amount of money leaving your revenue stream each month, written as a percentage of overall revenue.
Churn rate = (# of churned customers in a period ÷ total # of customers to start period) × 100
Most SaaS companies find measuring revenue churn over customer churn more helpful, as the former method better indicates the business’s health. You could lose a thousand freemium customers in 30 days with little impact on your bottom line, but you’ll find it harder to stomach the sudden loss of a quarter of your revenue in a month.
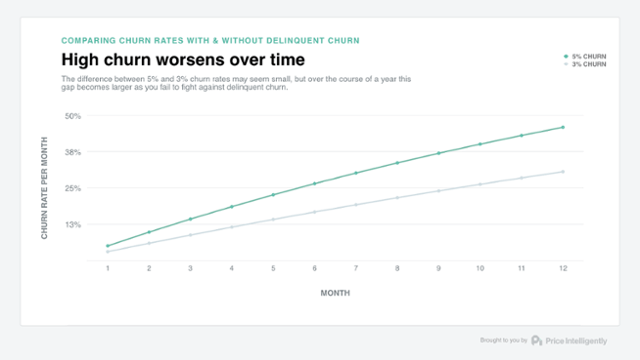
Churn tracking isn’t massively helpful to very early-stage SaaS companies. It isn’t too difficult to find two or three new customers to replace those who have churned when you have only 100 customers. However, as the company grows, minimizing churn becomes a critical goal. That 3% churn rate, translated to a million customers, means losing 30,000 customers monthly. You simply can’t sustain replacing that many customers on a monthly basis.
Churn also compounds over time. When annualized, a 3% monthly churn rate turns into a 36% churn rate, meaning you need to replace more than a third of your entire customer base just to maintain the same revenue. The more customers you have, the more you need to invest in retaining those customers before you start working on other growth efforts.
Some companies prefer the more positive “customer retention rate (CRR)” measurement to determine how many customers they hold onto. CRR is simply the flip side of the coin: if you have a 3% customer churn rate, you have a 97% CRR. However, sugar-coating this loss in customers doesn’t impart the same urgency as focusing on the customers that bailed, especially when your churn rate is too high to be considered healthy. Talk candidly about the money you’re losing as customers disengage with your product so you can start working on ways to shore up your leaky faucet.
Monthly recurring revenue measures your customers' total revenue in a single month. Multiplying this value by 12 months gives you the annual recurring revenue (or “run rate”). You can work out your MRR manually, but you can also use tools like ProfitWell to calculate all your SaaS metrics for you in real-time.
ARR = Total contract value / # of years
Recurring revenue makes the SaaS business model appealing compared to other alternatives. Your customers keep paying you monthly as long as you continue providing value through your services.
Unfortunately, many young SaaS companies fall into the trap of undervaluing their services. They don’t charge enough to make the business sustainable. Your SaaS company will become self-sustaining much earlier if you iterate on your pricing strategy until you’re charging enough to allow consistent growth.
The number of important metrics to track broadens as a SaaS company matures and solidifies its market presence.
Late-stage SaaS enterprises have the bandwidth and infrastructure to delve deeper into nuanced metrics, allowing them to refine strategies, uncover hidden opportunities, and fortify their industry dominance. It's a shift from foundational growth to mastering the art of scalability and innovation.
Activation rate is one of the most important SaaS metrics because users experience activation as an aha moment, where they first realize your product’s value for themselves.
Activation = # of users to successfully reach your critical event / total # of users
Activation rate is arguably the most important SaaS metric of them all. This especially rings true in a product-led growth model, where the in-app user experience becomes a driving force for improvement.
Users experience activation as an aha moment, where they first realize your product’s value for themselves. This event differs from product to product. It often takes a combination of nuanced user journey mapping, user interviews, and behavioral analytics to discover which in-product actions correlate to long-term success and retention.
Locate your product’s aha moment so you can shorten the time it takes new users to see value, activate, and begin adopting your product more deeply.
📖 Read more about how to find your product’s activation event
Also referred to as average revenue per user (ARPU) or average revenue per customer (ARPC), this metric allows you to zoom in on specific cohorts of customers to get a better sense of each segment’s value.
ARPA = MRR ÷ total # of active subscriptions
Say your company has recently made an effort to increase the monetary value of its subscriptions. As a result, your overall revenue has increased—but you aren’t sure if that’s because you have more users or if you’ve actually managed to increase the average revenue per account over time.
You need to compare your current ARPA rate to one from a previous month to determine the success of your efforts. First, identify your MRR from a month last year and divide it by the number of active accounts in that same month. Then, choose the same month from this year and make the same calculation. If your most recent ARPA figure is higher than last year’s, you can confidently say that your average account is more valuable now than it was a year ago.
Note that choosing a single month for your ARPA works for companies whose subscription models payout on a monthly basis. Companies who charge for quarterly or even yearly subscriptions should instead use their quarterly or annual recurring revenue instead of MRR in their ARPA formula. This provides a more apples-to-apples comparison of the applicable time periods.
CAC measures the amount you spend on sales, marketing, and other associated costs to acquire a new customer. To get it, you divide the total amount spent on sales and marketing across a given month by the number of customers acquired during that period. The resulting figure is your CAC.
CAC = Total $ spent on sales & marketing over a period ÷ # of customer acquired within period
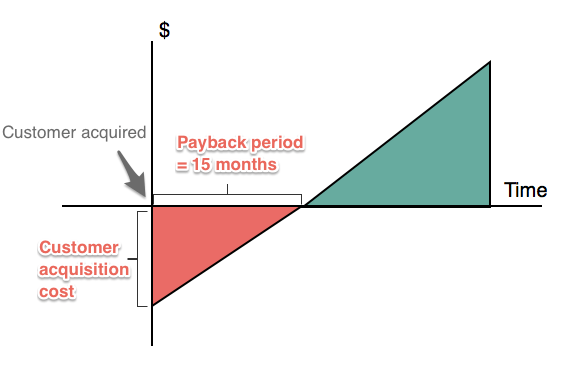
Sometimes it takes months or even years to earn back the money invested in bringing a customer in. Startups often find the amount they can spend on acquiring customers restricts their growth, making cash flow difficult in the first couple of years of operation.
The faster your business recovers CAC, the faster it can reinvest in more marketing. SaaS companies should aim to recover this cost within 12 months to remain healthy.
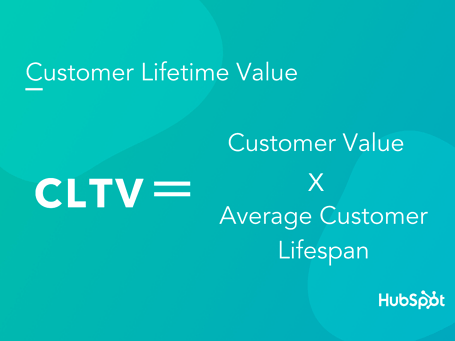
Customer lifetime value (CLV or LTV) represents the total revenue an average customer generates over the lifetime of their account. The longer customers keep using your service, the higher their lifetime value.
LTV = (Customer revenue × customer lifetime) – cost of acquisition and maintenance
Customer lifetime value is one of the most important SaaS metrics because it allows you to predict how valuable customers will be to your business over time. This gives you a long-term perspective on customer engagement strategies.
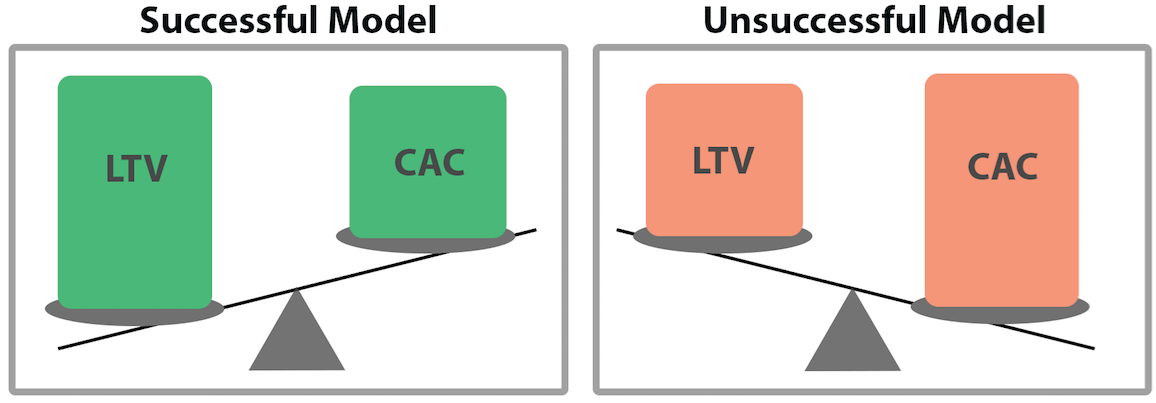
This comparison of your acquisition costs and lifetime value provides insight into whether your marketing efforts drive sustainable growth.
LTV-to-CAC ratio = Customer lifetime value over a specific period : customer acquisition cost over a specific period
Think of it this way: if you spend $1,000 to bring in a customer who nets your company $1,000 during their life cycle, you’re not going to make any money. In fact, your company will lose money once you factor in other operational costs.
An acceptable LTV-to-CAC ratio is 3:1. If you make $1,000 on a customer over time, you should only spend a little over $300 to bring them into the fold. However, companies interested in achieving growth should set their sights even higher. Few businesses would complain if they only spent $100 on marketing for every $1,000 customers they converted.
This formula measures how long it’ll take to recoup the costs (usually from sales and marketing) of acquiring a new customer. Also known as “months to recover CAC,” this metric can be even more valuable than the LTV-to-CAC ratio as it gives a better idea of the cash flow needed to increase acquisition.
CAC buyback period = CAC/MRR from a new customer
If your CAC is $500 and a new customer pays $25, it’d take you 10 months to recoup your costs. The less time it takes you to recover your customer acquisition costs, the quicker it is for revenue generated by new customers to cover the costs of acquiring them.
The goal of identifying your CAC buyback period is figuring out how to reduce it. You may need to either increase your pricing or reduce how much you spend.
Expansion revenue covers increases in MRR (or one-time payments) when an existing customer upgrades to a more expensive plan.
Expansion revenue = Total MRR generated by upselling and cross-selling
Focus on expansion revenue to combat the inevitable effects of churn. Über-successful expansion revenue actually pushes your effective churn rate into the negatives. First coined by David Skok, negative churn occurs when expansions or upsells exceed the value you’re losing each month due to revenue churn.
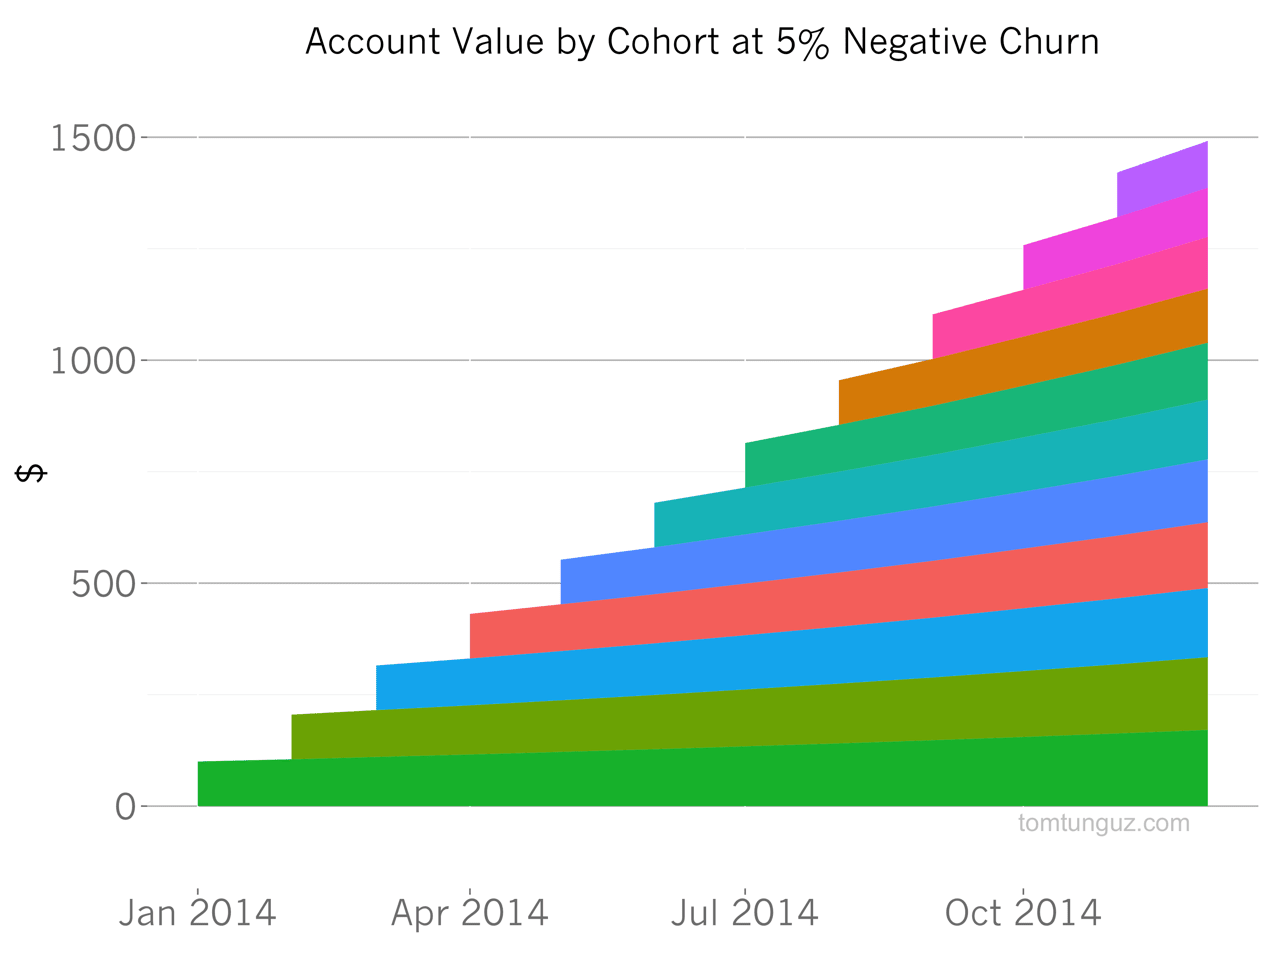
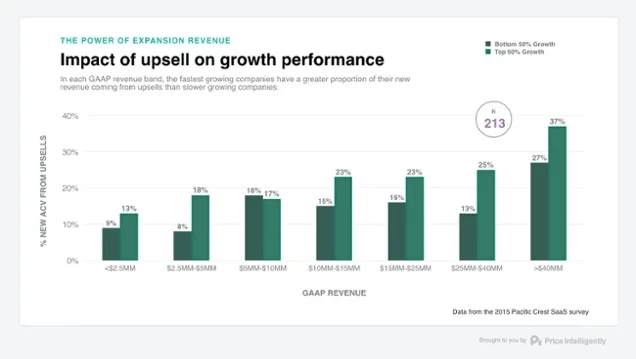
It is much easier and cheaper to upsell customers to more powerful versions of your product than to acquire net-new customers. It’s three times cheaper to generate expansion revenue than it is to gain new accounts.
Shift your goals from a model that narrowly focuses on net-new acquisition to one that prioritizes expansion revenue for a dramatic impact on growth. ProfitWell recommends that at least 30% of your revenue come from expansions.
Net promoter score (NPS) directly measures how much value your customers gain from your SaaS product.
With an NPS survey, of course!
NPS calculation lets you quickly discover why customers might be dissatisfied and use their feedback to improve your product. The qualitative data from customer feedback help determine whether you have product/market fit, especially in the early stages of a SaaS business.
You only need to ask your customers one simple question to measure your NPS: “How likely are you to recommend us to a friend or colleague?”
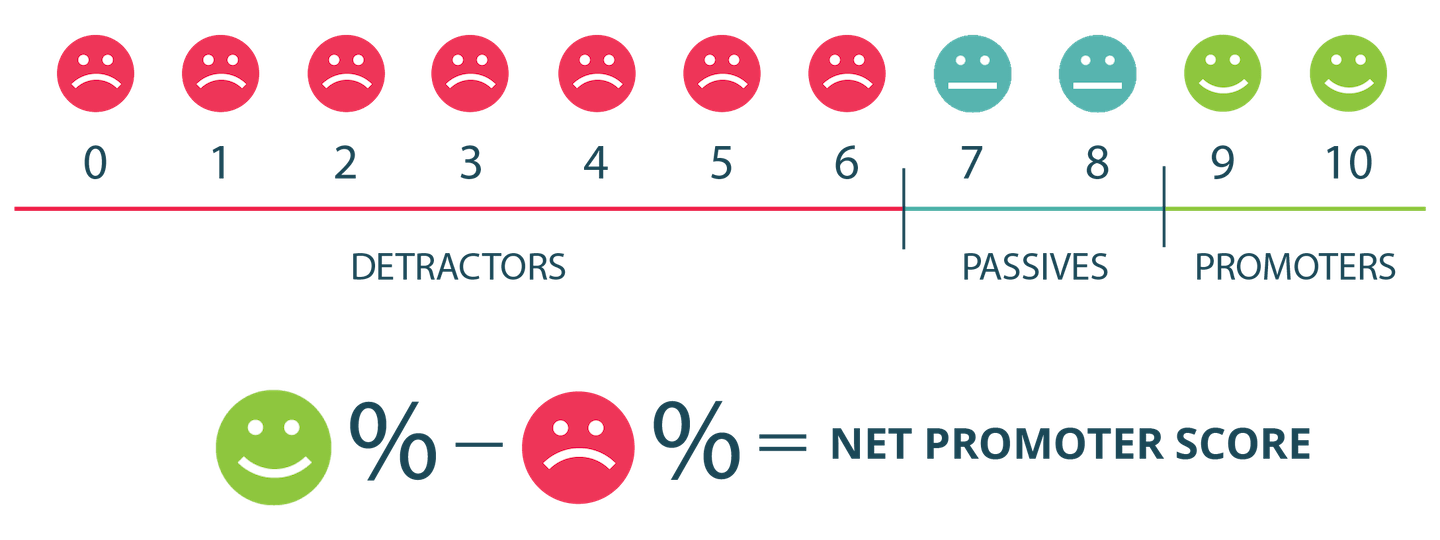
Customers answer on a scale from 0 to 10, with 0 being the least likely to recommend and 10 being the most. You should follow up with detractors (scores 6 or below) to find out what’s making them unhappy with your service.
An elevated look at your overall retention rate, net revenue retention (NRR), shows how many customers you’ve retained and how much they’re spending. While getting new business is important, retaining existing customers is much easier and less costly.
NRR rate = (Retained revenue / Base recurring revenue) x 100
You might already track your overall retention rate, but it’s also important to consider the number of customers you’ve retained and how much they spend. After all, not every customer uses your product in the same way.
Some retained customers may have upgraded and adopted new paid features or services while others may have downgraded their plans or reverted to the free version of your app (if you use a freemium pricing structure).
Your net revenue retention rate tells you how much revenue you’ve generated after considering your expansion revenue and churn rate.
Understanding how much revenue retained customers bring in shows you the effectiveness of your up- and cross-selling efforts and can highlight any weaknesses that lead to downgrades.
Most of the SaaS metrics detailed above focus on Big Picture metrics that impact the company on a macro level. But they don’t always indicate the whys of the matter. For instance, you may discover your churn rate is higher than you’d like it to be. Unfortunately, this doesn’t tell you anything about what’s causing your churn rate to spike.
Companies need to zoom in on their products to get to the heart of why. This often involves finding ways to measure an app’s stickiness, or its ability to delight customers and keep them coming back for more. These three metrics will help you size up your product’s stickiness and pinpoint its most valuable features.
Identifying the number of users who regularly use your product also helps you understand the behaviors of your power users.
NAU = (# of daily users + number of returning users)
Keep an eye on the number of people using your app regularly. Customers with consistent usage habits stay longer and are more likely candidates for upselling than those who only hop into your product occasionally. Comparing your subscriber figures against your active users will reveal how many paying users aren’t using your product at all. These users are at risk of churning and require re-engagement efforts to bring them back into the fold.
Determine how many sessions a week you consider “power usage.” From there, create a cohort of users who log into your product at least that many times and study their behaviors within their app. Identify the particular features they engage with (and don’t) and use your insights as the basis for onboarding, marketing, and UX tweaks to transform average users into power users.
You should also calculate your active users to evaluate the impact of these marketing and UX optimization efforts. For example, imagine you alter your product tour based on the behaviors of your power users. An analysis of usage rates in users that joined subsequent to the changes can show whether they were successful or not.
Active user measurement differs from company to company because “active” may mean different things depending on the product. Two or three weekly log-ins might work well for a banking app but not a social media platform. Additionally, there are several time periods that companies use to calculate their active users:
Ultimately, the best time period for your company depends on what you’re using the figure for. Only looking at monthly active users can lead you to miss some nuances within your day-to-day traffic flow. Meanwhile, exclusively analyzing your daily users causes you to lose sight of big-picture patterns. Regardless, NAU is one of the most essential SaaS analytics.
Seat utilization rates help measure whether customers get the most bang for their buck from your product.
Seat utilization rate = # of seats being used regularly ÷ total # of seats
Seat utilization rates help measure whether a customer is getting the most bang for their buck. Many SaaS companies base their subscription models at least in part on the number of seats allotted to a given customer. And some companies pay premium prices to allow a greater number of individual users to access seat-based software.
A high utilization rate indicates that most of the users a customer pays for actually use your product. It means they’re more likely to continue using your product because they see the value in it. If anything, these customers are great candidates for upselling from their current subscription level.
Meanwhile, your seat utilization rates could come in low for one of 3 reasons:
A popular subscription model for SaaS companies involves selling session-based plans. These plans sell a set number of log-ins instead of a set number of users.
Average sessions per day = total # of sessions over a given time span ÷ the number of days in that time span
The other popular subscription model for SaaS companies involves selling session-based plans. These plans sell a set number of log-ins instead of a set number of users. Any company that uses this model needs to have a comprehensive understanding of how many sessions different demographics of users log each day to set pricing points for their users. If you know how many sessions your power users log daily, you’ll have a better understanding of how to set pricing points that maximize your revenue.
But the benefits of session analysis extend beyond setting pricing points. User segmentation will help reveal the habits of specific demographics that can guide flow optimization and promote feature stickiness.
For example: Create a segment of the users who log the most daily sessions and study their in-app behaviors. Take note of the features they use most often and compare them to those users logging the fewest number of sessions. Note which features your power users frequently engage and promote those features across marketing channels to encourage better and more consistent usage habits amongst low session users.
This metric reveals how many of the total number of features your product offers the average user engages with.
Depth of usage = (# of features used ÷ # of available features) × 100
The development of happy and engaged users is a two-sided coin. On one side is user activation, which happens very early in a well-designed onboarding flow. But continued engagement requires users to branch out past the feature at the heart of this aha moment to the other benefits tucked away in your app.
Enter the other side of the coin—depth of usage. This metric reveals how many of the total number of features your product offers the average user engages with. A high depth of usage confirms that you’ve continued to develop and release features that align with users’ needs. It’s also indicative of a high-quality UX and intuitive UI.
In-app messaging serves as a sound go-to for fixing low depth of usage. Usually, the issue isn’t that your feature is bad or that customers don’t like it. Many times, customers simply can’t find the feature buried in your UI or don’t even know it exists. Modal windows, slideouts, and contextual tooltips all help to highlight some of your product’s less obvious features without interfering with the user’s journey.
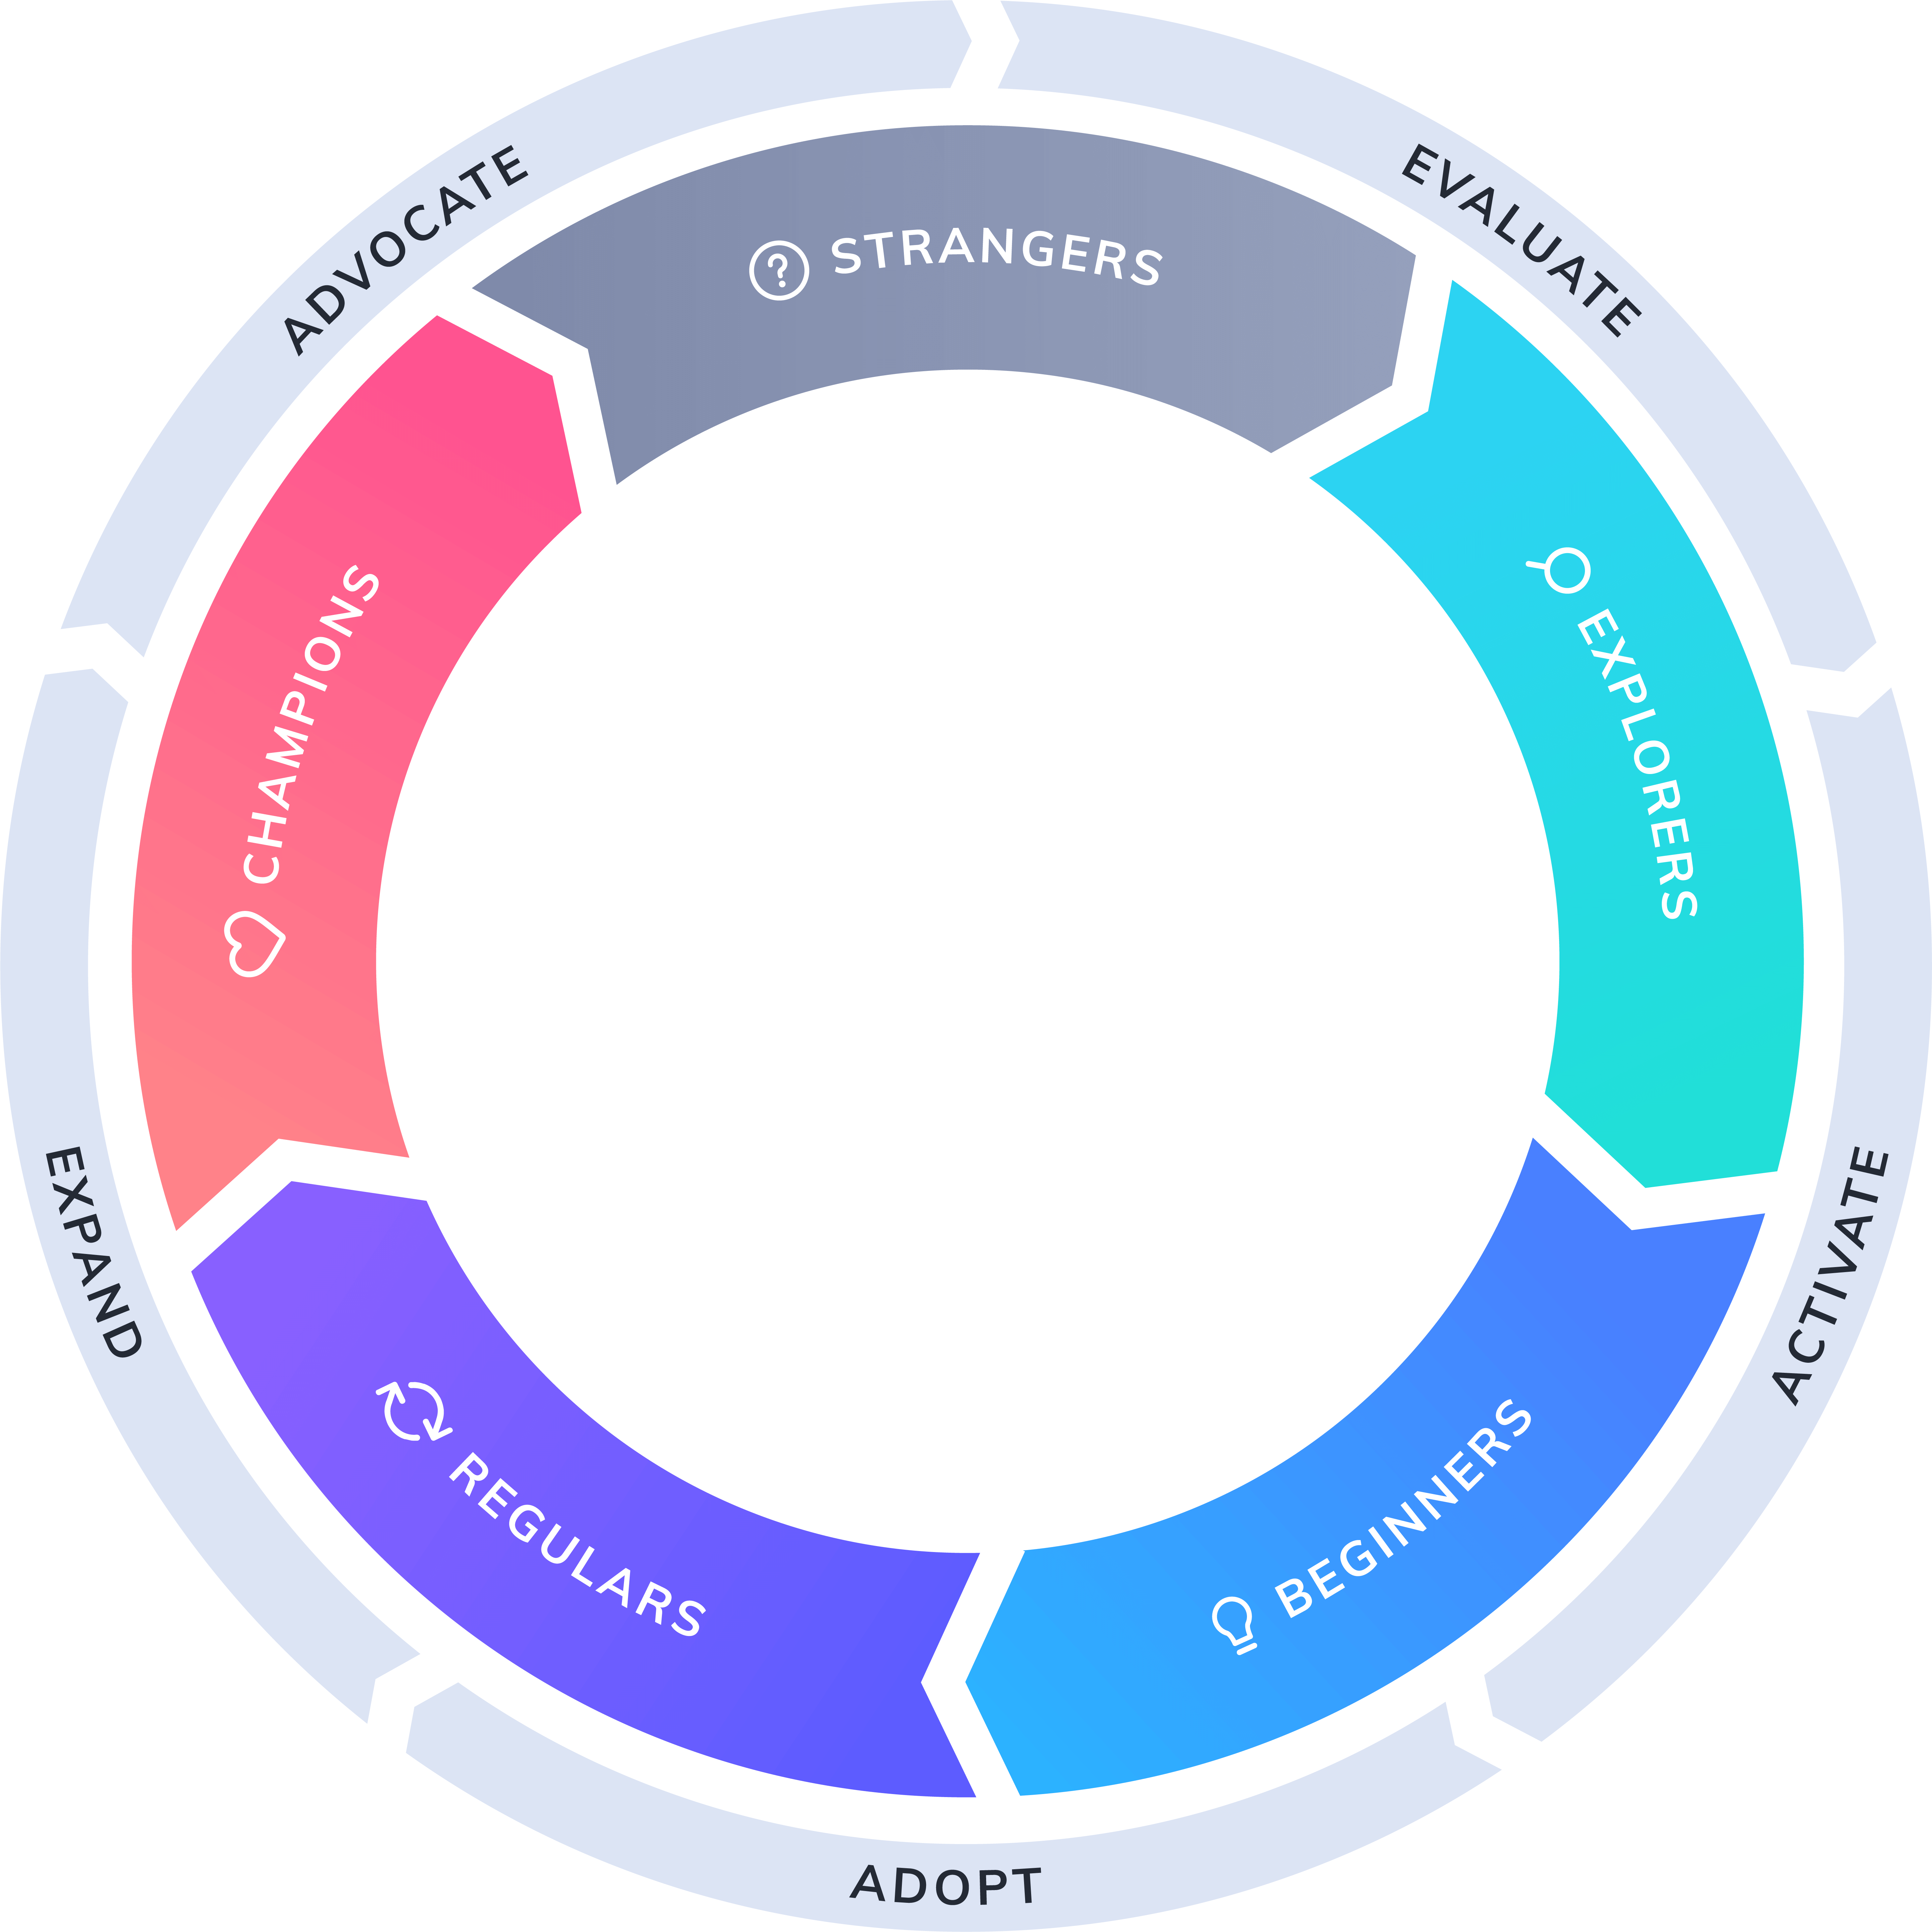
You need to draw a clear line between the UX and your company’s bottom line, which is exactly why we developed the Product-Led Growth Flywheel. This methodology helps you make smart investments in the user experience to grow your business.
Learn more about how the Product-Led Growth Flywheel helps optimize your UX to boost growth
Good UX leads to good engagement, and good engagement leads to higher usage. Dazzle your users with a stellar UX from the get-go with a winning onboarding process designed with help from Appcues. Appcues enables you to build seamless product tours powered by in-app messaging that guide users without distracting them.
Activation rate is arguably the most important SaaS metric of them all. This especially rings true in a product-led growth model, where the in-app user experience becomes a driving force for improvement. If a user can’t discover the value of your product quickly, they’re unlikely to develop good usage and dig deeper into your app. Positive and frequent engagement minimizes churn risk, which in turn provides foundational stability for growing your product.
The Rule of 40 provides a baseline objective for companies to strive for that enables growth and drives revenue. Many early-stage SaaS companies sacrifice short-term profitability to grow quickly. However, they can’t neglect revenue entirely without damaging the product’s long-term viability. Thus, the Rule of 40 serves as a baseline compromise for companies to achieve:
Revenue growth rate + margin of profitability ≥ 40%
Gross margin compares your total sales over a period of time against the cost of producing the good or service. A gross margin for a SaaS company may fluctuate in the early days as development costs keep the margin low or even potentially in a negative range. However, most healthy SaaS companies find themselves with a margin in the 60–70% range—that is, they bring in 60–70% more money on a product than they spend.
Viability can’t be measured through a single metric, so you’ll need to pursue KPIs that tie directly into what you’re trying to achieve with your product in both the short and long term. Usually, this means focusing on two groups of metrics: growth related and retention related. Companies can’t survive for the long haul without a steady revenue stream, and sales reps have a hard time outselling a high churn rate. If these two groups of metrics indicate growing revenue and low attrition, the odds are your company is viable or well on its way to viability.
Ultimately, any financially viable business needs to generate more money than it spends, and SaaS companies are no exception. Healthy SaaS companies should:
Follow these rules of thumb to ensure your company doesn’t lose money on every new customer. These principles also enable your company to begin seeing positive cash flow before you run out of capital.


