
.png)
Your product is full of features that could genuinely help people - if they only knew those features existed.
Here's an uncomfortable pattern most SaaS teams recognize: you ship a feature, write a changelog entry, maybe send an email. A few power users notice. Everyone else keeps doing exactly what they were doing before. The feature sits there, invisible to the people who need it most, while your team moves on to building the next thing.
That gap between "shipped" and "adopted" is where a lot of product value goes to die. The gap is a strategy problem, not a building problem. Teams that treat feature launches as one-time events end up with products where users engage with a fraction of what's available, wonder if they're getting their money's worth, and eventually churn.
Feature adoption is when someone learns about a feature in your product and starts to use the feature regularly. It's a sign that they both know the feature exists and find it valuable enough to keep coming back.
It's worth distinguishing feature adoption from feature discovery. Discovery is awareness - a user sees a tooltip, reads a changelog, or stumbles across a menu item they hadn't noticed before. Adoption goes further. It means the user tried the feature, found it useful, and incorporated it into their workflow. Discovery is the top of the funnel. Adoption is what happens when users make it all the way through.
Where does feature discovery fit? Feature discovery sits upstream of feature adoption. It's the awareness step - the user now knows the feature exists. But discovery alone doesn't move business metrics. A user who has "discovered" your reporting feature by seeing a tooltip but never runs a report has not adopted it. Your adoption strategy needs to bridge the gap between "I know this exists" and "I use this regularly."
Here's a concrete example: imagine you ship a new dashboard filtering feature in your analytics product. A user who clicks the "What's New" badge and reads about it has discovered the feature. A user who applies filters to their dashboard three times in the first two weeks has adopted it. That distinction matters because discovery without adoption means something is broken - either the feature isn't delivering value or you're not guiding users far enough.
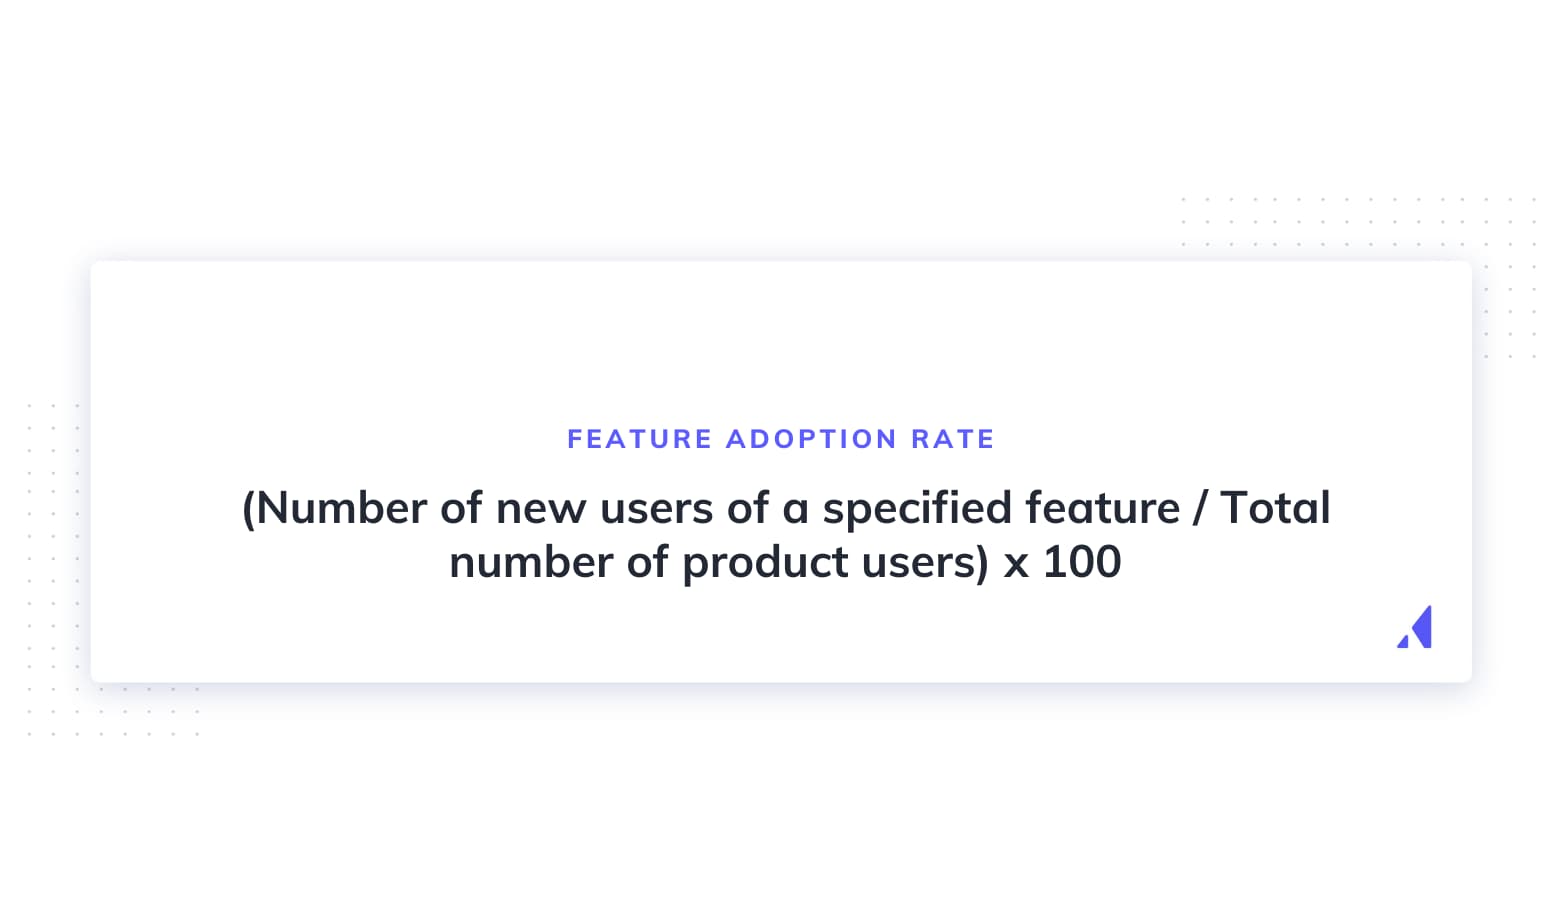
You can measure feature adoption with a simple formula:
Feature adoption rate (%) = (number of users who adopted a specific feature / total number of product users) x 100
Feature adoption isn't just a product metric - it's a retention and revenue lever. When users adopt more features, they build deeper habits inside your product. That makes them stickier, more likely to expand, and significantly harder for a competitor to peel away.
Feature adoption belongs on every product and growth team's radar for three reasons:
Tracking feature adoption also gives you diagnostic power. It helps you spot which features are winners (high adoption, high retention correlation), catch problems early (a new feature nobody touches after launch), and understand the "why" behind churn. When a customer leaves, knowing which features they never adopted tells you exactly where the experience fell short.
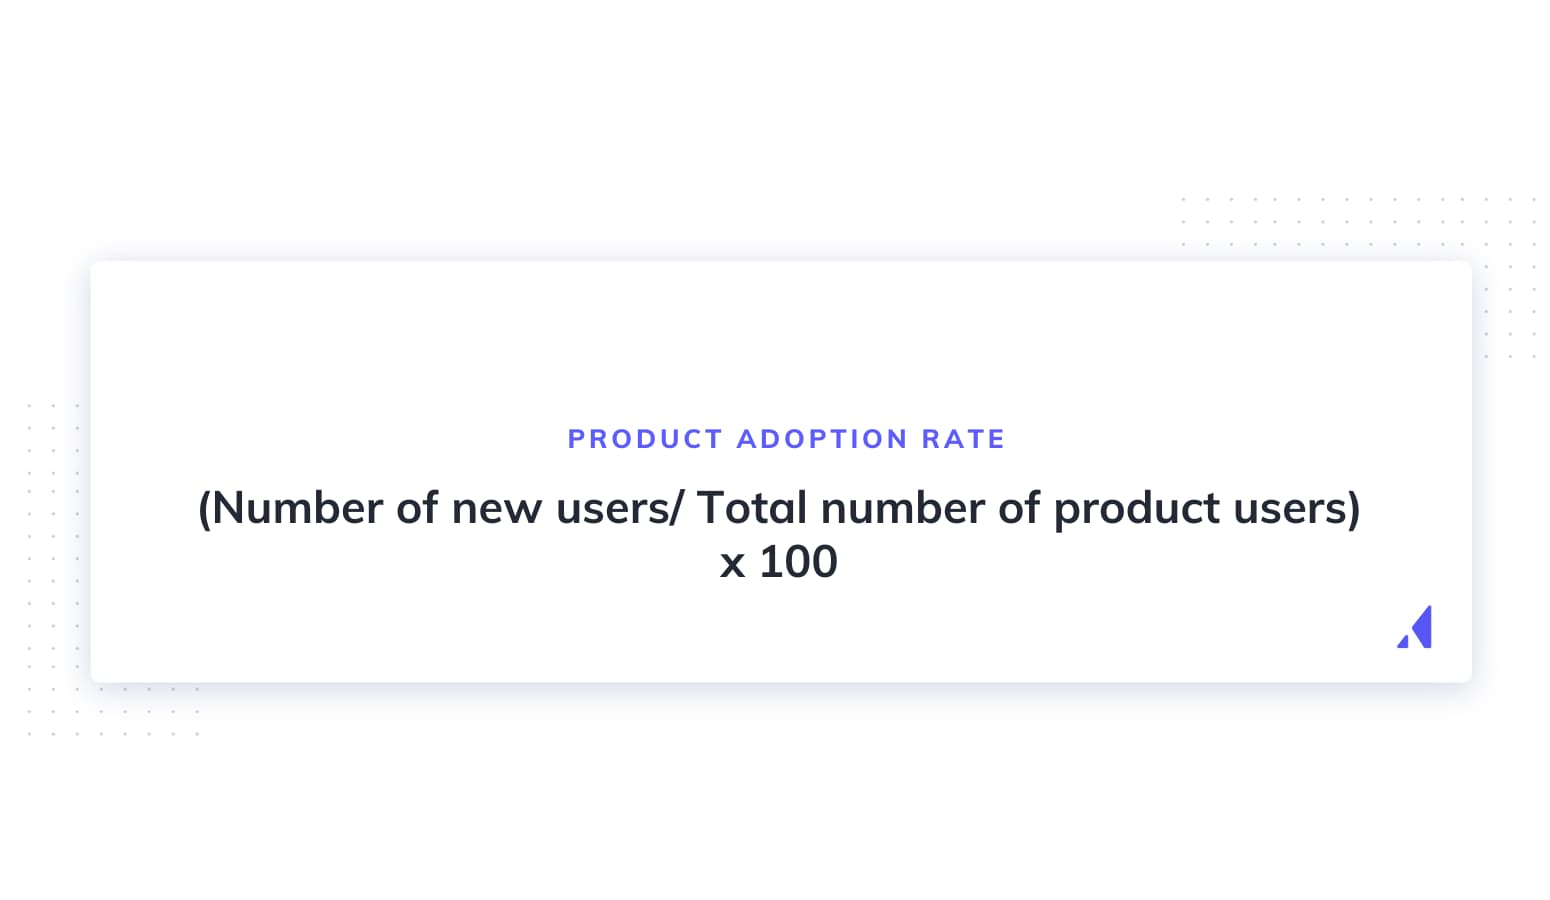
Product adoption and feature adoption are related but not interchangeable. Product adoption measures whether a user has embraced your product overall - they've signed up, experienced the core value, and become a regular user. Feature adoption zooms in on individual capabilities within the product.
Think of it like a restaurant. Product adoption is a diner choosing your restaurant as their regular spot. Feature adoption is them discovering and falling in love with specific dishes on the menu. You want both, but they require different strategies.
Tracking the right metrics gives you a clear picture of whether features are being discovered, tried, and ultimately woven into users' workflows. Here are the key ones to watch:
Feature adoption rate measures the percentage of total users who use a given feature. It's your headline metric. A low adoption rate on a high-value feature means users either don't know about it or don't see the value.
Formula: (number of users who adopted a feature / total number of users) x 100
For example, if 600 out of 5,000 users regularly use your reporting feature, your feature adoption rate is 12%.
Breadth of adoption measures how many different features each user has adopted. Users who adopt multiple features are significantly stickier - they have more reasons to stay and more workflows tied to your product.
Formula: (users who used a specific feature / total users) x 100
For example, if your product has 10 features and the average user regularly uses 4 of them, your breadth of adoption is 40%. A low number here suggests users are only engaging with a narrow slice of your product's value.
Depth of adoption measures how frequently or intensely users engage with a feature. It separates casual users from power users and tells you whether people are getting real value or just poking around.
Formula: total feature interactions / number of feature users
For example, if 200 users generated 3,000 interactions with your dashboard filter feature in a month, the average depth is 15 interactions per user. Rising depth usually signals that the feature is becoming part of users' core workflow.
Time to adopt measures how long it takes between a user's first exposure to a feature and their regular use of it. Longer time-to-adopt often signals friction - either the feature is hard to find, hard to understand, or hard to see the value of.
Formula: date of regular use - date of first exposure
If users first see your Calendar View feature on day 1 but don't start using it regularly until day 14, your time-to-adopt is 14 days. Shortening this window through better onboarding or contextual prompts is one of the fastest ways to boost adoption rates.
Feature retention rate measures the percentage of users who continue using a feature over time. It tells you whether adoption sticks or whether users try something once and drift away. A feature with high initial adoption but low retention likely has a UX or value-delivery problem worth investigating.
There is no universal benchmark for what counts as a "good" feature adoption rate. The number varies significantly based on feature type, product maturity, your industry, and the size of the feature's target audience within your user base.
A core workflow feature (like creating a project in a project management tool) might see 80-90% adoption. A power-user reporting feature might sit at 15-20%, and that could be perfectly healthy if only a subset of your users needs it.
The most useful approach is to establish your own baseline for each feature, then focus on improving incrementally. Compare adoption rates across similar feature types within your product, and track changes after each intervention (a new tooltip, a revised onboarding flow, a feature announcement campaign). Your own trend lines will tell you far more than any industry-wide number.
Knowing your overall feature adoption rate is useful, but it doesn't tell you where adoption breaks down. That's where the funnel comes in.
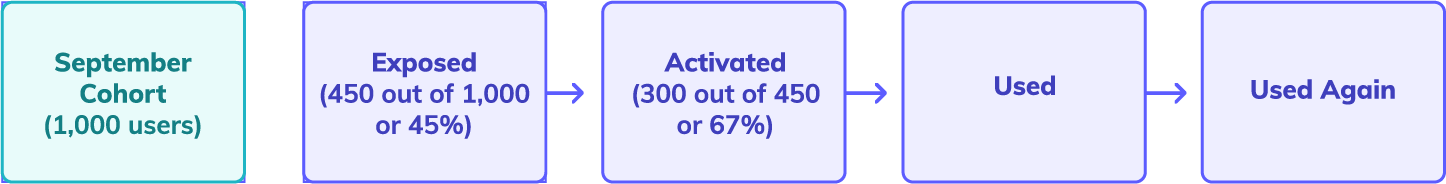
Justin Butlion introduced a four-stage framework that breaks feature adoption into discrete, measurable steps: Exposed, Activated, Used, and Used Again. Each stage has its own drop-off rate, which tells you exactly where to focus your efforts.
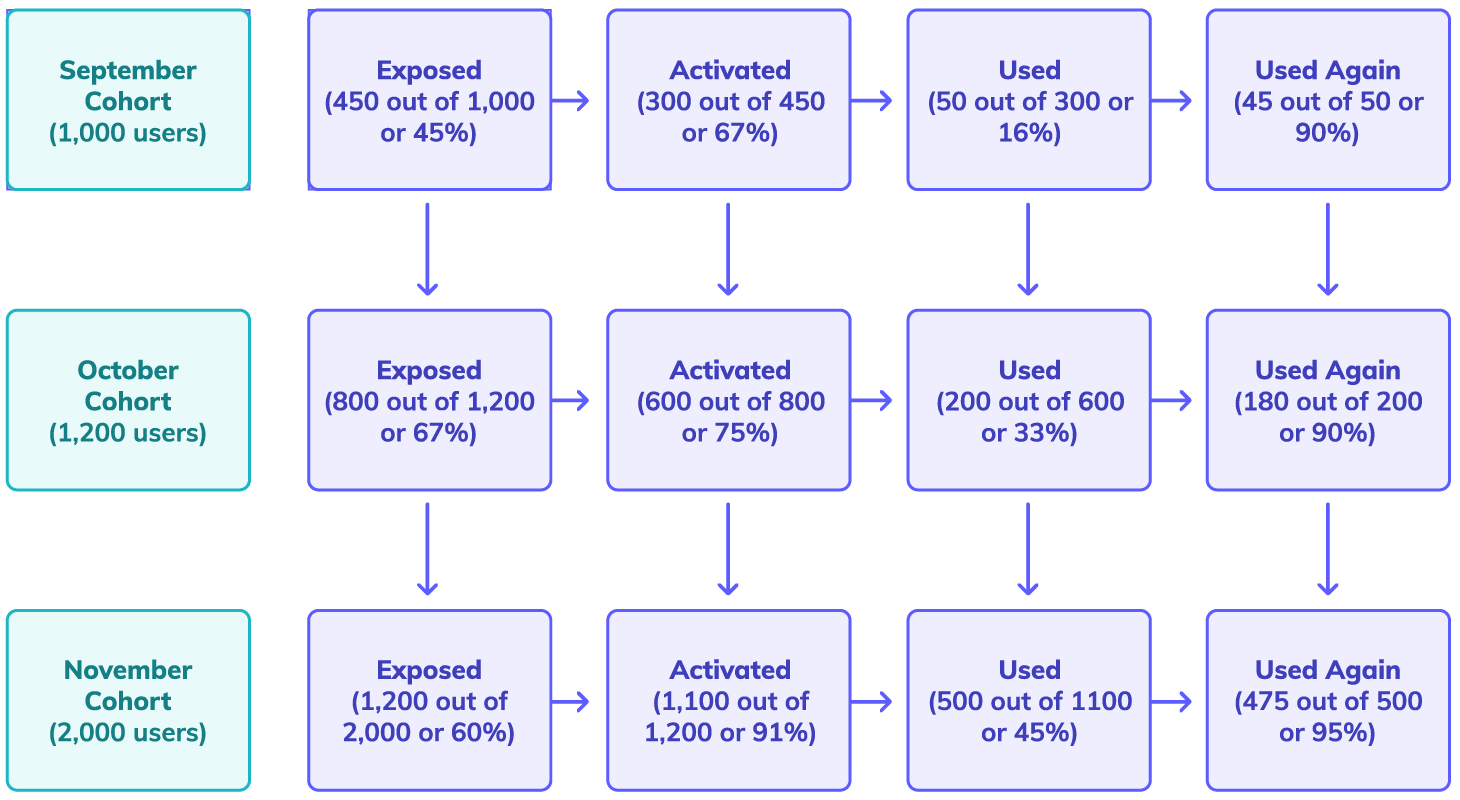
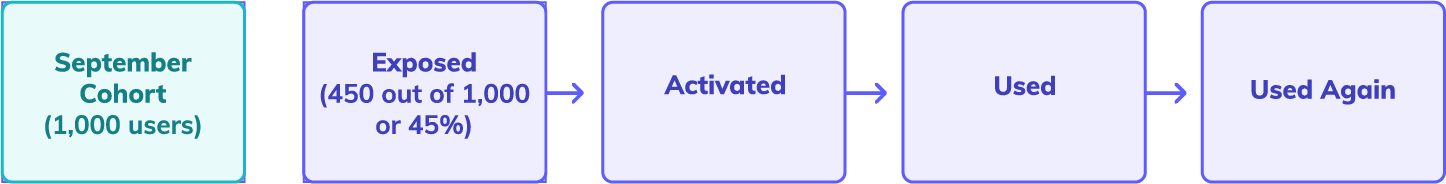
Let's walk through how this works with a hypothetical example. Imagine CueIt, a project management tool that just launched a new Calendar View feature.
This is the awareness stage. The user knows the feature exists. For CueIt's Calendar View, exposure might happen through an in-app announcement modal, a "What's New" badge, or an email about the latest release.
Let's say CueIt has 5,000 active users, and 3,000 of them saw the Calendar View announcement. That's a 60% exposure rate. If this number is low, the problem isn't the feature - it's your announcement strategy.
The user tries the feature for the first time. Of CueIt's 3,000 exposed users, 1,500 clicked through to try Calendar View. That's a 50% activation rate from exposed users.
A big drop-off here usually means the path from awareness to action has too much friction. Maybe the announcement didn't link directly to the feature, or the user couldn't figure out how to get started.
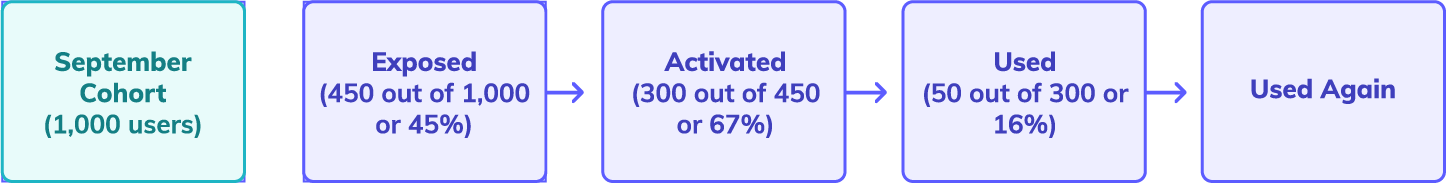
The user engages with the feature meaningfully. This goes beyond a first click - it means the user actually accomplished something. Of CueIt's 1,500 activated users, 800 used Calendar View to manage their schedule at least once. That's a 53% usage rate.
If users try a feature but don't actually use it, the feature might not deliver value quickly enough, or the UX might not be intuitive enough for a first session.
The user comes back and uses the feature a second time (or more). This is true adoption. Of CueIt's 800 users who used Calendar View once, 400 came back to use it again. That's a 50% repeat usage rate.
Drop-off at this stage is the most concerning - it means users saw enough value to try the feature but not enough to make it part of their routine.
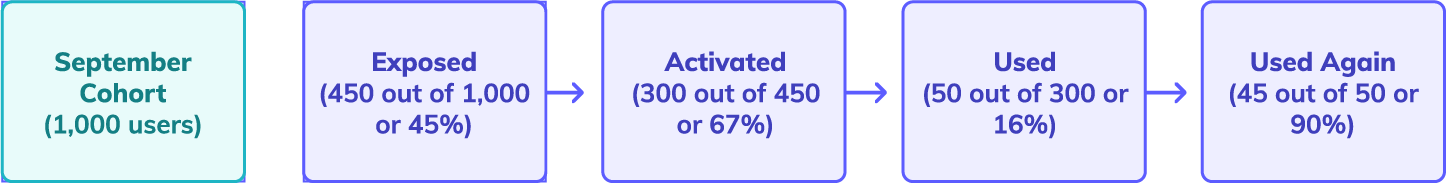
Looking at the full funnel: CueIt started with 5,000 users and ended with 400 who truly adopted Calendar View. That's an 8% end-to-end feature adoption rate. But the funnel tells a much richer story than that single number. It shows that exposure was decent (60%), activation was reasonable (50%), and the biggest relative drop-offs happened between activation and use, and between use and repeat use.
Each stage gives you a different intervention point. If exposure is low, the problem is your announcement channels. If activation lags, there's too much friction between awareness and the first try. If usage drops off, the first-run experience needs work. And if users don't come back, the feature may need UX improvements or a contextual nudge.
A feature that ships without an adoption strategy is a feature that gets ignored. Here are five practices that consistently move the needle.
Feature blindness is real. Users develop habits and routines inside your product, and they stop noticing things outside those routines - even features that would save them time or solve a pain point they complain about regularly.
HubSpot ran into this with their Sidekick email tracking tool. Users who had installed Sidekick would sometimes disable it without realizing it, then forget the feature existed entirely. HubSpot's solution was to auto-re-enable tracking and use subtle in-app reminders to surface the feature at the moment it was most useful - when a user was composing an email.
The lesson: don't rely on a single launch announcement. Use contextual reminders that appear when a user is in a workflow where the feature would help. 10 tooltip examples to help level up your in-app messaging is a good starting point for designing these kinds of nudges. You can build in-app modals, tooltips, and hotspots that trigger based on user behavior rather than a calendar date.
Slack does something similar. When a user manually performs an action that could be automated with a workflow, Slack surfaces a subtle suggestion to try Workflow Builder. The reminder is contextual, non-intrusive, and timed to the exact moment the feature would deliver value.
Effective feature launches use multiple channels and unfold over time, with in-app messaging as the anchor.
The key insight: in-app messaging tends to outperform other channels for feature adoption because it reaches users at the moment they're most likely to try something new - when they're already using your product. For more on planning a multi-channel launch, see how to plan out your feature release to drive product adoption.
The best feature adoption experiences don't feel like onboarding at all. They feel like the product is anticipating what you need. Trigger-based flows that appear at the right moment - when a user reaches a workflow where the feature would help, or when they hit a friction point the feature solves - consistently outperform generic walkthroughs.
Context and timing matter more than the medium. A tooltip that appears when a user is struggling with manual data entry to suggest an import feature will convert better than a full-screen modal that fires on login. The principle: meet users in their moment of need, not yours.
Build these triggers around behavioral signals - a user performing a repetitive task, visiting a page for the third time without taking action, or reaching a milestone that unlocks a new capability. When the prompt matches the context, adoption follows naturally.
Adoption data tells you what is happening. Feedback tells you why. The combination is where the real insights live.
Deploy in-app surveys at key funnel stages. After a user is exposed to a new feature but doesn't activate, ask what held them back (a one-question micro-survey works well here). After a user tries a feature once but doesn't return, ask whether it met their expectations. These touchpoints give you qualitative signal that pure analytics can't provide.
Then close the loop. If feedback reveals that users don't understand what a feature does, improve your announcement copy. If they tried it but found it confusing, invest in a guided first-run experience. Feature adoption improves fastest when you treat adoption data and user feedback as two halves of the same picture.
Release notes are one of the most underrated tools in your adoption toolkit. A persistent, well-maintained log of product updates gives power users a reason to check back regularly and gives your customer success team a reference to point to during calls.
Good release notes are scannable, benefit-led, and linked to deeper resources. Each entry should answer: what changed, why it matters, and how to try it.
Microsoft does this well with Outlook. Their release notes page gives users a chronological list of updates, each with a clear description and a link to learn more. For guidance on writing yours, see how to write release notes (+5 great examples).
Ready to build in-app experiences that drive feature adoption? Appcues makes it easy to create targeted modals, tooltips, and feature tours without waiting on engineering. Book a demo and see how it works.
Even teams that care about adoption fall into predictable traps. Here are the ones that hurt the most:
Theory is useful, but nothing illustrates feature adoption better than seeing how real companies handle it. Here are four examples of teams tackling different adoption challenges.
HubSpot discovered that users of their Sidekick email tracking tool would often disable the feature accidentally or forget it existed after initial setup. Rather than accepting the drop-off, HubSpot built a system that automatically re-enabled tracking when it detected the feature was inactive, and used contextual in-app reminders to surface Sidekick at the moment users were composing emails - exactly when the feature delivers value.
The takeaway: feature adoption isn't a one-time event. Users forget, habits change, and features fall out of routines. Ongoing, context-sensitive reminders are more effective than a single big launch.
AWeber, an email marketing platform, added a persistent "What's New" button to their product interface. Instead of relying on one-time announcements that users might miss, they created an always-accessible changelog that users could browse on their own terms.
This approach works because it respects different user learning styles. Some users want to be told about new features the moment they launch. Others prefer to discover things at their own pace. A persistent discovery mechanism serves both groups without being intrusive.
CMap, a professional services management platform, used targeted in-app announcements to introduce their newest features to the right user segments. Rather than showing every user the same modal, they segmented their announcements by user role and usage pattern, ensuring that each user saw only the features relevant to their workflow.
The result: higher engagement with announcements, lower dismissal rates, and stronger adoption among the segments that mattered most. Relevance drives adoption far more than reach does.
Indiegogo, the crowdfunding platform, used in-app hotspots to guide campaign creators toward new tools they'd added to the campaign management experience. Rather than interrupting users with modals, they placed subtle, pulsing hotspots next to new features within the campaign editor.
This approach worked because campaign creators were focused on building their campaigns - a modal would have been a distraction. Hotspots let users discover features organically, at the exact moment they were working in the area where the feature lived.
Start by mapping your current adoption funnel for one key feature, identify the biggest drop-off point, and build a targeted intervention. Ready to improve feature adoption in your product? Appcues can help you build the in-app experiences that turn feature awareness into feature adoption - without waiting on engineering.
Want to see how Appcues can help you turn feature launches into feature adoption? Book a demo and we'll walk you through it.


.png)
%2520(1).png)