
.png)
If you work at a SaaS company, you may think you have a pretty good understanding of the pirate metrics. You can probably recite them—acquisition, activation, retention, referral, and revenue—and you might even remember where they come from (thank you Dave McClure).
But how deep is your understanding of these metrics, really? Do you know which pirate metrics you're overlooking—or what that's costing you?
Most small-but-growing SaaS companies focus first on acquiring users and getting them into the funnel. Then, they focus on retaining those users and turning them into loyal, long-term customers. That's great.
But many companies underestimate the importance of the second A in McClure's AARRR—activation.
Helping new users reach their first aha moment and find success with your product early on has huge downstream effects. In order to understand how best to optimize your customer journey, you need to first understand exactly how much activation affects your growth.
Let's get back to basics for a minute: What are pirate metrics?
Pirate metrics is a fun name for a serious set of SaaS metrics that make up a 5-step framework for SaaS growth, first envisioned by angel investor and the founder of 500 Startups David McClure.
Part of what makes the framework so powerful is that it encourages product folks to look beyond the vanity metrics:
"McClure got people past vanity—how many people are looking at my page?—and into thinking about the whole customer lifecycle, the most efficient way to break it down, and how each part could be improved. It was a sea of change in the way founders thought about their businesses." — Archana Madhavan, Product Marketing Manager at Amplitude
In our model, we define each of the pirate metrics (also called AARRR metrics) as:
The order of the original pirate metrics resembles a freemium revenue model—McClure put revenue after retention and referral, like freemium apps do.

But a free-to-paid revenue model, in which companies offer a free trial and then convert users to paid plans, is becoming increasingly popular. Subscription SaaS users are often acquired through some form of free plan or free trial. Then, monetization happens when these users sign up for paid subscription plans and become paying customers.
Our model reflects this by placing revenue right after activation.

Activation—or the moment when a customer achieves your product's promised value—reflects how efficiently you're spending money on acquiring customers.
A higher activation rate means better efficiency. Activation also directly determines revenue, because you need to be able to show free trial users the value of your product in order to convince them to pay for it.
In short, activation is an incredibly important metric to measure and optimize.
For subscription-based businesses, the impact of percentage improvements compounds over time. If you have 10,000 customers, for example, a 10% increase in customer retention, will have a much larger impact on customers retained than it would if you had 100 customers.
To demonstrate the sustained effects of each pirate metric, we built a calculator to model the impact of each metric on monthly recurring revenue (MRR) after 12 months.
We chose to calculate MRR rather than ARR because for startups and growing businesses, small changes can make a big difference and it's useful to keep a pulse on frequent, incremental changes in business activity.
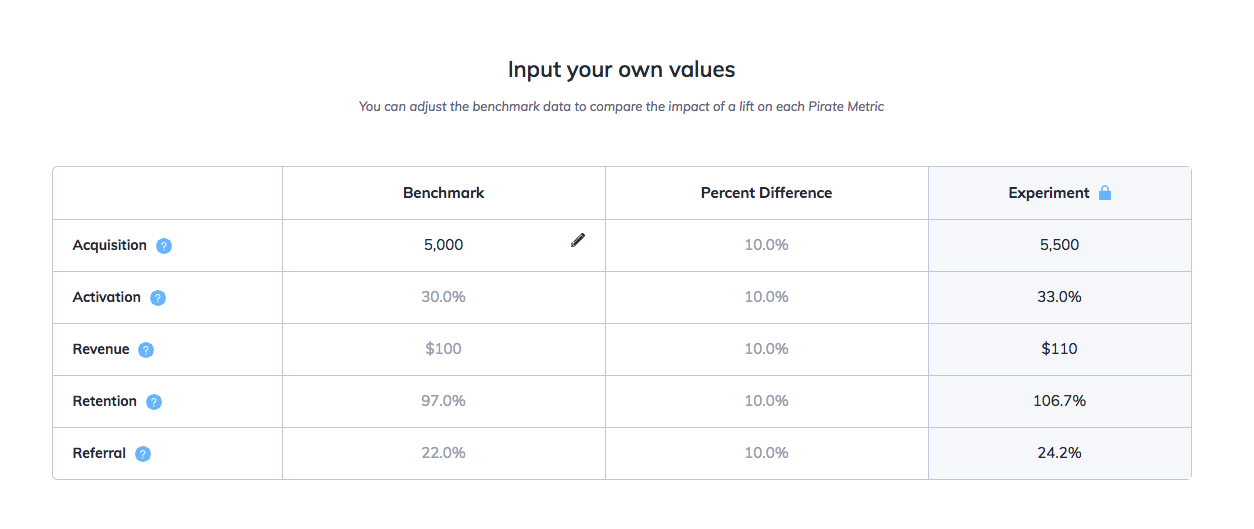
Here's a look at the calculator:
We chose to calculate MRR rather than ARR because for startups and growing businesses, small changes can make a big difference and it's useful to keep a pulse on frequent, incremental changes in business activity.
To model each metric’s impact on MRR, let's first calculate what the MRR after 12 months would be with each pirate metric set at an industry benchmark:
Then, one by one, we'll improve each pirate metric by 25%, and calculate the effect that has on MRR after 12 months. Again, that’s:
the percent difference in revenue between the benchmark of metric vs. benchmark of metric + 25% lift.
Let's put this into context with some hypothetical numbers to model how these different metrics can impact your bottom line.
The purpose of this model is to allow you to conceptualize how each pirate metric has a direct impact on your bottom line.
That said, our model is a simplified representation of a hypothetical, small-but-growing SaaS company.
In this model, we're imagining that we can control all of those other factors and isolate each pirate metric one by one. Of course, in a real company these changes wouldn't happen in a vacuum and would influence each other.
It's also important to note that the relative importance of each metric will change depending on your vertical, your product, and your stage of growth. For example, if you already have a massive customer base, percentage increases in retention will have a much larger effect than the same incremental increase in a smaller customer base. Because we're using a percent difference as the equalizer, the relative importance of each metric is not absolute.
We highly encourage you to put your own business metrics into the calculator as the benchmarks to calculate exactly how important each metric is to your SaaS company's growth.
Let's take a closer look at each of these metrics so you can start putting our model to work.
Activation metrics can include everything from pageviews to sales qualified leads (SQLs). In our model, acquisition measures the number of users entering your free trial. For our acquisition benchmark, let’s assume 5,000 free trial sign-ups. You can either use this number or enter your own—if you don't know monthly free trial signups, just estimate.
According to a study of SaaS companies by Alex Turnbull, CEO and founder of Groove, on average, 8.4% of traffic converts to a trial.
Using our estimate of 5,000 free trial signups, we'll calculate how a 25% lift on our acquisition benchmark impacts 12-month MRR after one year:
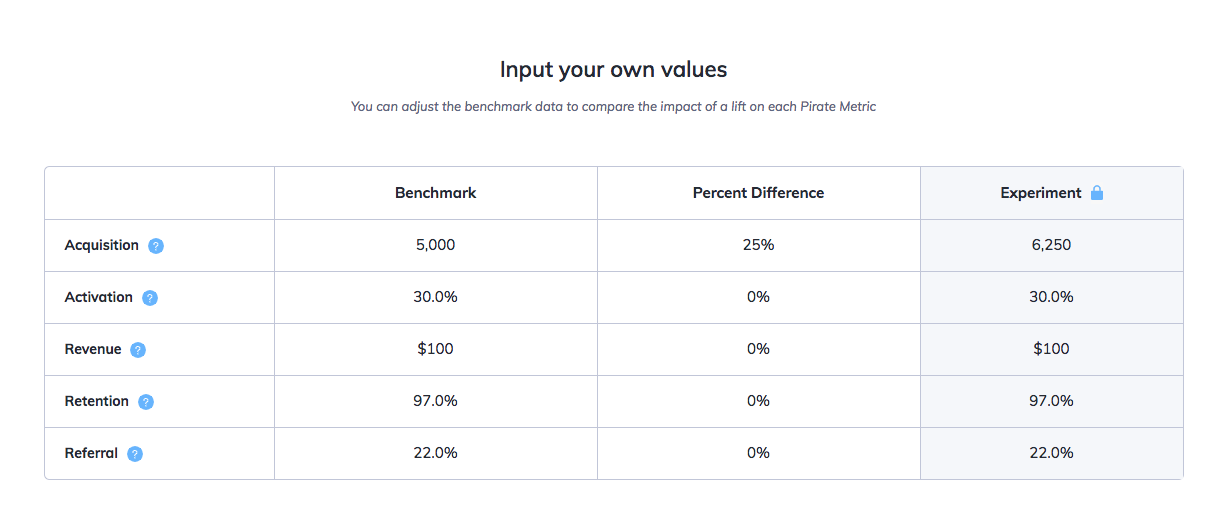
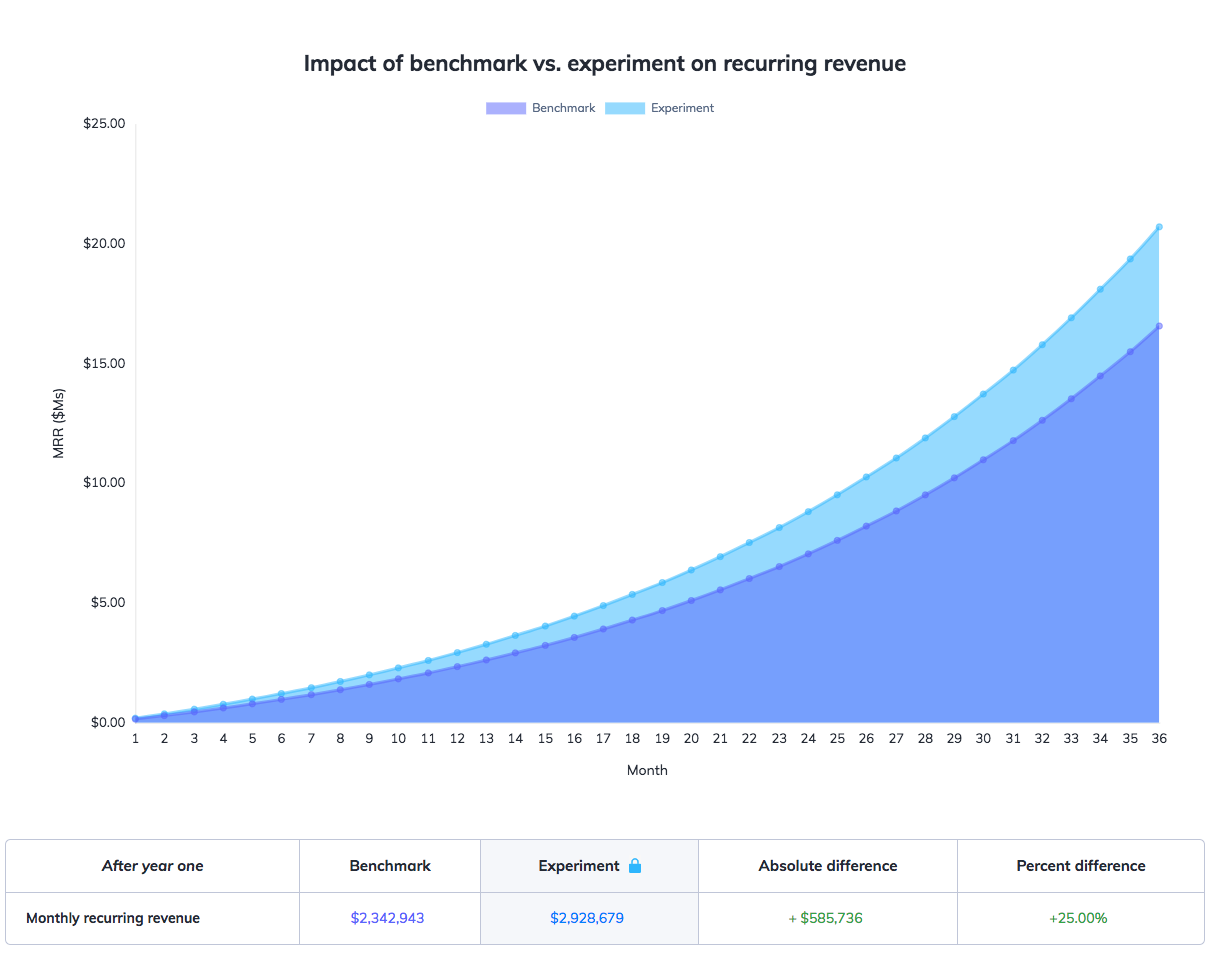
As you can see, the 25% lift in acquisition resulted in a 25% lift in MRR. It makes sense that these lifts are equal because acquisition determines the size of your funnel.
Therefore, if you 10x acquisition, you’ll 10x your MRR. And that’s pretty uninteresting. Don’t worry though—other metrics have a higher impact on MRR.
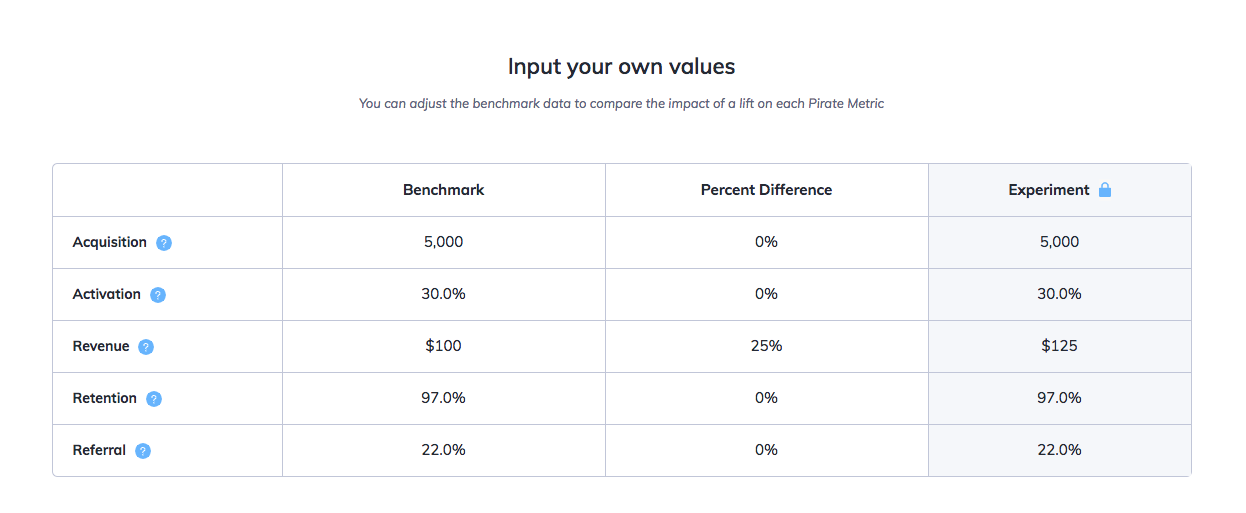
Activation occurs when users first achieve the value you promised. It’s expressed as the percent of activated users out of total acquired users.
As a benchmark for activation rate, we’ve chosen 30% based on the sad reality of mobile app onboarding and our own experience helping companies improve their user onboarding.
You can use this benchmark for your own calculations, or pull data on your monthly percentage of activated users. Activation look different for every product, depending on each product's aha moment. Make sure you define exactly what determines an activated user, so you understand what to do with the data that you're looking at!
Here’s how activation impacts MRR:
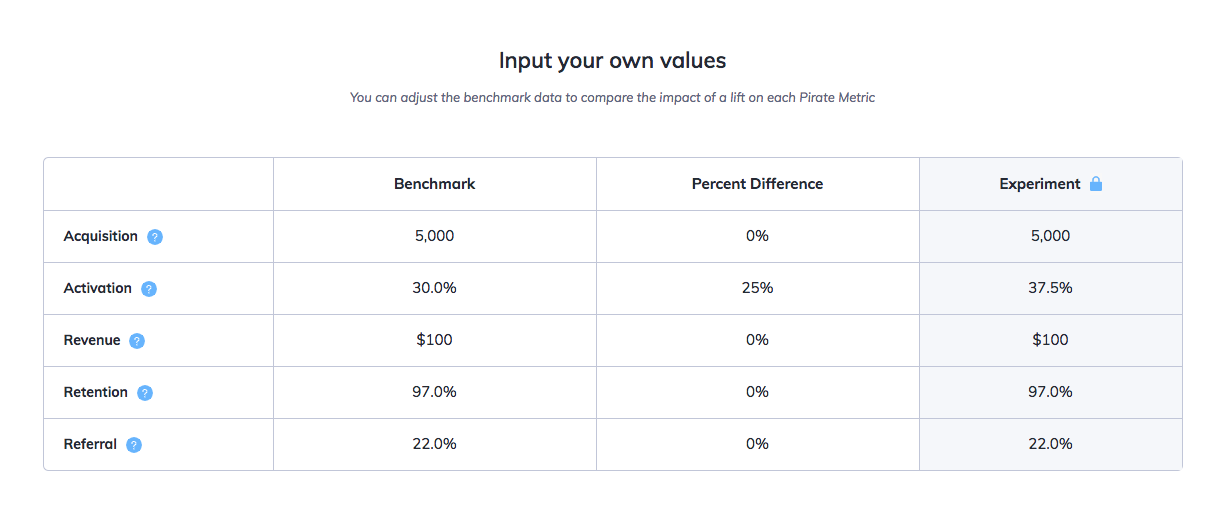
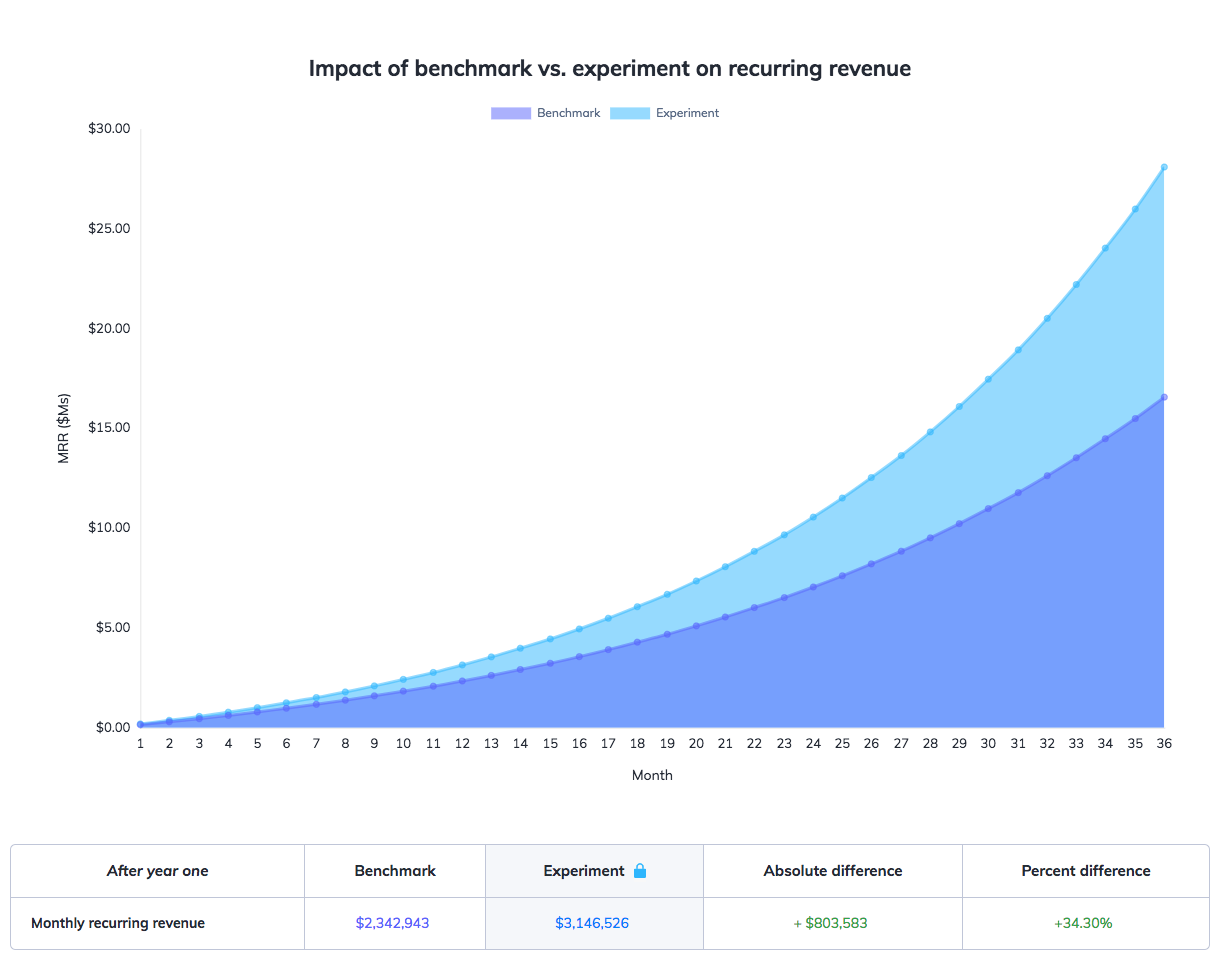
A 25% increase in activation yielded a 34.3% lift on MRR after 12 months. It turns out the metric you've been overlooking can give you outsized returns.
In our free-to-paid model, activation directly determines how much revenue is coming in the door. That makes activation an important upstream metric that impacts not only revenue from new users but also recurring revenue from existing users.

And remember that in our simplified model, we're not calculating the effects that increases in one metric might have on others. In reality, increases in activation would likely result in increases in retention and referrals, too—making the increase in MRR even greater.
What constitutes an activation event is different for every product. To truly understand which action leads to the user's first aha moment, you'll need to study your user journey map closely, talk to your users, and implement tracking around that action.
Examples of activation: When a user completes their first ride with Uber or Lyft, when a customer receives a grocery delivery from Instacart, when a new Gmail customer sends their first email, etc.
In our model, revenue represents the ACV, or average contract value, that a user pays per month.
To keep things simple, we modeled a mid-sized subscription contract for an SMB SaaS company and set revenue at $100. In your own calculations, you can input your own average contract value for the revenue benchmark.
We can then calculate the impact revenue has on MRR:
A 25% lift in revenue corresponds to a 25% lift in MRR.
In our model, revenue serves a similar function to acquisition: Both metrics are fixed numbers, not percentages like the other pirate metrics. They have similar one-to-one impacts on the bottom line. Acquisition sets the size of the funnel in terms of numbers of users, and revenue sets the Funnel Size in terms of dollars.
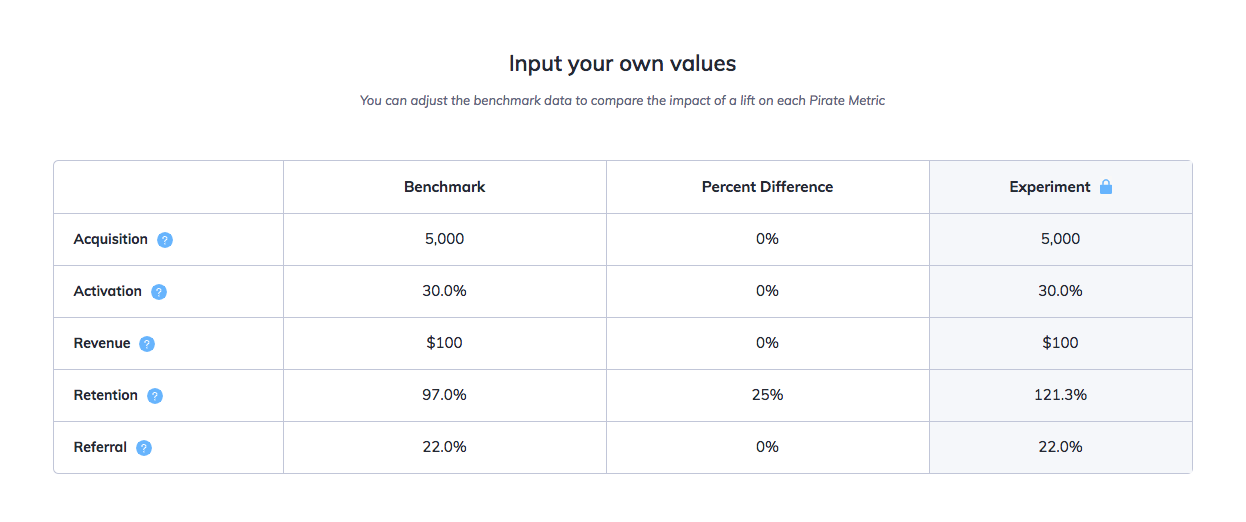
Retention measures the number of users who continue paying for your product month over month. Retention is typically a much higher percentage than activation because it’s easier to get users to maintain a habit than to start one.
We're using a 97% benchmark for monthly retention for SMB companies, as observed by Redpoint VC Tomasz Tunguz and affirmed by Point Nine Capital VC Clement Vouillon. If you have monthly customer retention data for your own company, you can input this metric as the benchmark in the calculator.
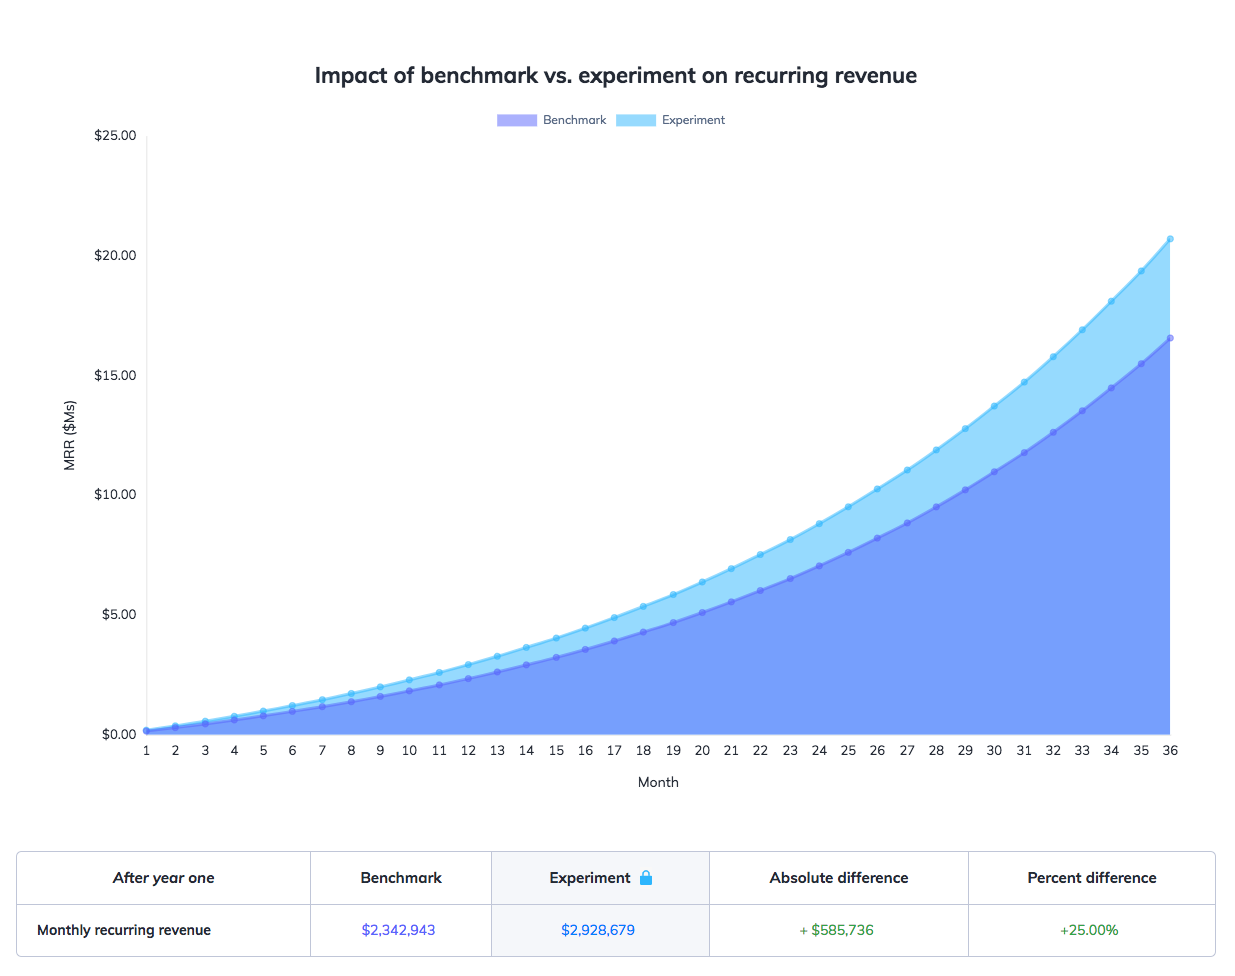
Let’s calculate the impact a 25% lift in retention would have on MRR:

The effect of retention on MRR is most similar to that of activation—they're both percentage-based bottlenecks. They can grow or shrink the size of the funnel.
In our model, payment occurs at activation. If payment was occurring at the retention cohort, activation would have less of an impact on revenue. If your business uses a free-to-paid model, you can try this out with your own data to see the relative differences in activation improvement and retention improvement.
Run a cohort analysis to dig into your retention and churn rates to find out where drop offs occur. Depending on your business model, you may wish to measure daily retention rates; for most products that don't depend on daily engagement, monthly retention and churn rates are more useful.
Referral measure the percentage of current users who successfully bring new users into your funnel. Referrals are therefore measured as a percentage of your entire existing user base—not just your new users.
We did some math based on referral benchmarks, and determined 22% to be a good referral rate benchmark for successful SaaS companies. You can always substitute your own referral rate for the benchmark if you have this data.
Let’s calculate the impact of a 25% lift on our referral benchmark:
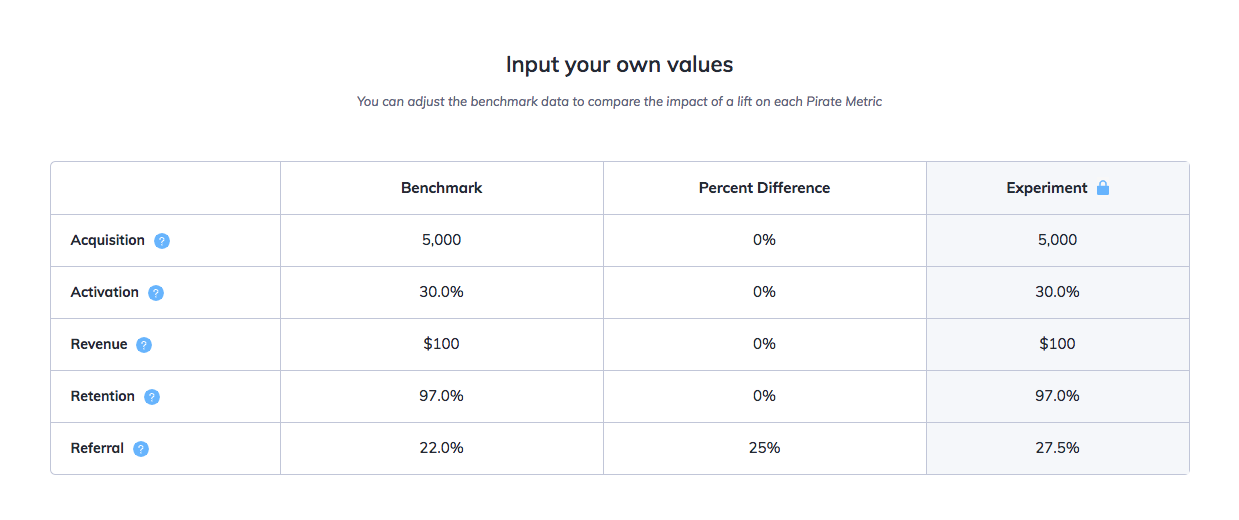
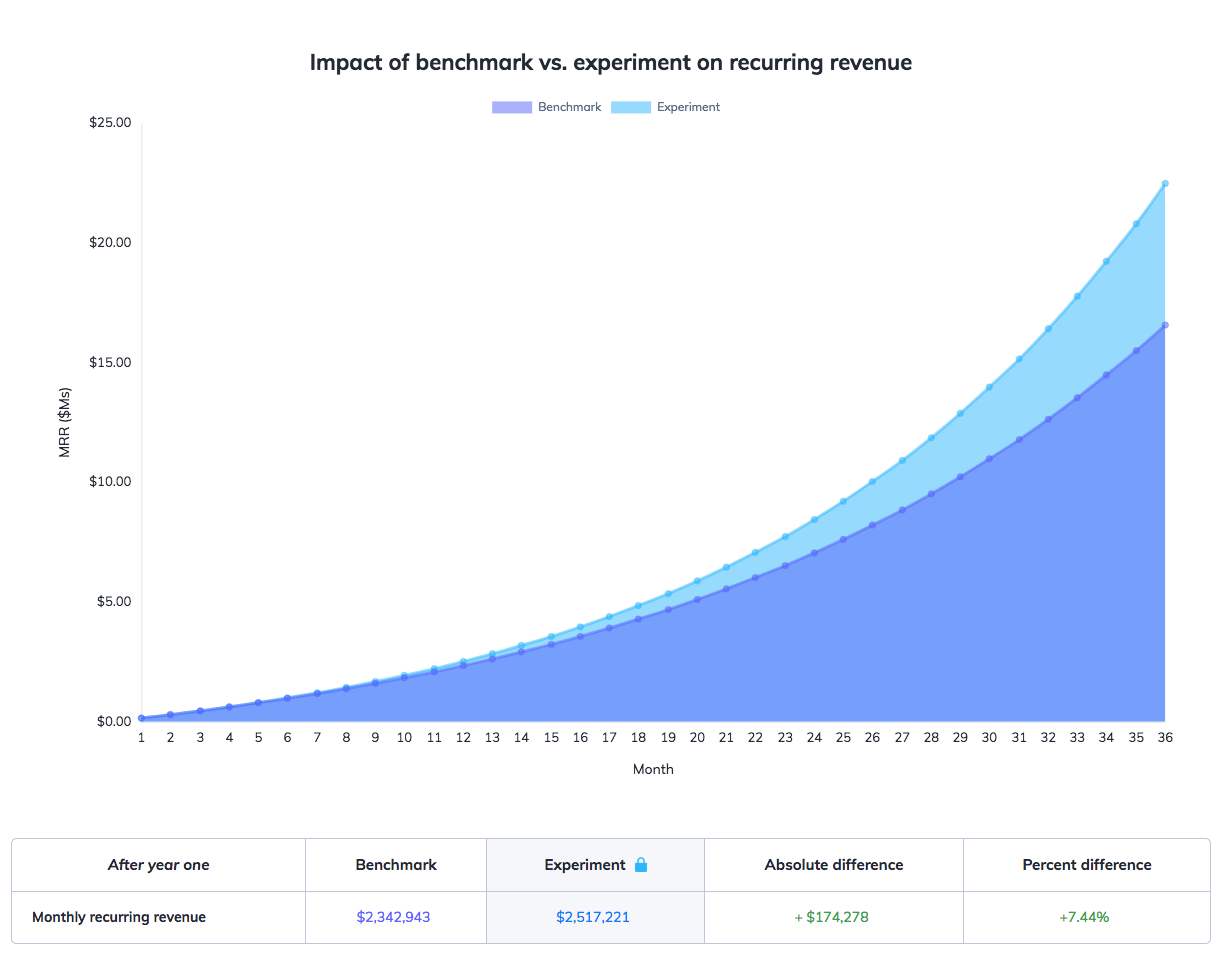
As you can see, a 25% lift off of our referral benchmark resulted in an underwhelming 7.4% MRR increase. For growth-minded folks that believe that viral loops are the holy grail, that number might come as a bit of a shock.
In our model, a 25% difference in activation increased MRR by:
These values are dependent on the benchmarks we chose in our simplified model. But when comparing each pirate metric's impact on MRR, it's clear that activation has huge downstream effects on your bottom line. If you're still overlooking this SaaS metric, you're missing out on untapped revenue and opportunities for growth.
So what can you do with these metrics now that you know how important they are? How do you increase your activation rates and get that lift?
For starters, you can take another look at your user onboarding. Ask yourself: Does this first-time user experience drive new users to their aha moment? Could we help them get there faster with better in-app messaging or a more streamlined onboarding flow? (The answer to that last question is almost always "yes.")
If you aren't already, consider using a third-party tool like Appcues that lets you create and iterate on your in-app messaging quickly and often. That way you can experiment with different messaging without putting pressure on your dev resources.
Some ways you can use in-app messaging to boost your pirate metrics:
Head over the Pirate Metrics Calculator to crunch some numbers. Figure out which part of the user journey you need to optimize in your own product to get the biggest lift. And then optimize it!


