The benchmark floor is brutal. The median app retains just 4% of users at Day 30 - and most verticals aren't much better. Knowing where you stand by industry is step one.
Onboarding is the highest-leverage fix. Apps that get users to a core value action in the first session see 2-3x better Day 7 retention. If your Day 1 numbers are weak, start here.
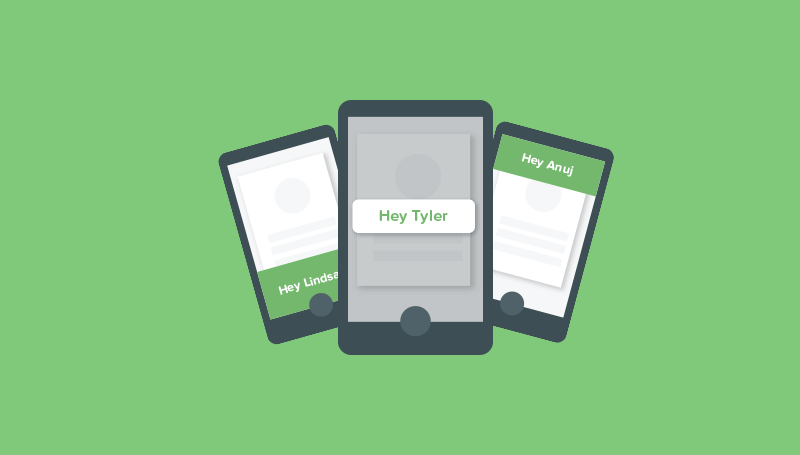
Re-engage early. The window to recover lapsing users closes within 3-7 days. Automated triggers for early-stage dormancy produce 2-3x higher return rates than waiting a week or more.
Here's a number that should make every growth team uncomfortable: the average mobile app loses three out of four users within a month of install (UXCam, 2026). That's not a failure of acquisition. It's a failure of what happens next.
If you're a lifecycle marketer, growth lead, or product manager responsible for keeping users engaged after they download, this article is for you. We'll cover what "good" app retention actually looks like across different categories, how to measure mobile app retention in a way that reveals real problems, and eight strategies that the highest-performing apps use to keep users coming back. You'll also find current benchmarks by industry, common mistakes to avoid, and real-world examples you can learn from.
The stakes are practical. Every percentage point of retention you recover compounds through lifetime value, expansion revenue, and referral rates. And the flip side is just as real: if your retention curve drops off a cliff after Day 1, no amount of acquisition spend can outrun it.
Most of the app retention strategies here don't require engineering resources to implement. They're built around behavioral segmentation, well-timed messaging, and onboarding optimization - the kind of work that growth and lifecycle teams can own directly. Let's dig in.
What is an app retention rate?
An app retention rate measures the percentage of users who continue actively engaging with your app over a defined period of time. It's the clearest signal of whether your product is delivering enough value for people to come back.
The definition sounds simple, but it hides an important nuance: mobile app retention is not the same as "didn't uninstall." A user who downloaded your app six months ago and hasn't opened it since is not retained - they're just taking up storage. Retention means active, intentional use.
How you define "active" depends on your product. For a grocery shopping app, an engaged user might be someone who opens it during their weekly trip. For a language learning app, it might be a 5-minute session every day. For a SaaS tool, it could be logging in and completing a core workflow at least once per week.
That definition matters because it drives your retention formula, your benchmarks, and ultimately the strategies you choose. An app that defines retention loosely (anyone who opened the app once in 30 days) will report higher numbers than one that tracks meaningful engagement - but the loose definition tells you almost nothing about whether your product is working.
Before you calculate anything, get specific about two things:
What engagement actions count? Pick actions tied to the core reason users downloaded your app. For an email client, that might be sending an email. For a fitness app, completing a workout.
How often should those actions happen? A daily habit app and a monthly budgeting tool have very different frequency expectations. Neither is wrong - but you need to define yours before the numbers mean anything.
How to calculate app retention rate
The basic formula is straightforward:
Retention Rate = (Users active at end of period / Users active at start of period) x 100
If you started the month with 1,000 active users and 120 are still active at the end, your 30-day retention rate is 12%. New users acquired during that period are excluded from the starting count - you're measuring whether existing users stuck around, not whether new ones showed up.
The Day 1 / Day 7 / Day 30 framework
Most teams track retention at three intervals, and each tells you something different:
Day 1 retention measures first impressions. Did users come back the day after install? This is your onboarding quality signal.
Day 7 retention measures early habit formation. Users who return after a week are starting to build your app into their routine.
Day 30 retention measures sustained engagement. This is where the retention curve typically flattens - the users still here are likely to stay.
Tracking all three gives you a retention curve, and the shape of that curve matters more than any single number. A steep drop between Day 1 and Day 7 suggests an onboarding problem. A gradual decline from Day 7 to Day 30 might mean users see initial value but aren't finding enough reasons to return.
Why cohort analysis beats aggregate numbers
Aggregate retention rates can mislead you. If you launched a big marketing campaign last month that brought in a wave of low-intent users, your overall retention will tank - even if your core product experience hasn't changed.
Cohort analysis solves this by grouping users based on when they signed up (or by behavior, segment, or acquisition channel) and tracking each group's retention independently. A weekly cohort view lets you see whether the users you acquired in Week 12 retain differently from Week 8 - and if so, what changed.
This is where the real insights live. A cohort view might reveal that users who complete your onboarding checklist retain at 3x the rate of those who skip it. That's not just a metric - it's a roadmap.
Rolling retention vs. classic retention
One more distinction worth knowing: classic retention counts only users who were active on exactly Day 7 (or Day 30). Rolling retention counts anyone who was active on Day 7 or any day after. Rolling retention paints a more forgiving picture and is useful for apps with irregular usage patterns (like travel or seasonal tools). Most benchmarks use classic retention, so be consistent about which one you're reporting.
Why app retention matters
Retention is the metric that makes every other metric work. Without it, your acquisition spend is a leaky bucket, your LTV projections are fiction, and your growth story has an expiration date.
The economics are stark
Acquiring a new mobile app user costs between $2.50 and $6.00 depending on the vertical and channel (Business of Apps, 2025). If 75% of those users are gone within a month, you're spending the bulk of your budget on people who never deliver value back. Research from Bain & Company has consistently found that increasing customer retention by just 5% can boost profits by 25-95%, because retained users cost almost nothing to re-engage and are far more likely to convert on upsells, referrals, and premium features.
Retention drives LTV
Lifetime value is a function of how long users stick around and how much they engage while they're there. An app with a 15% Day 30 retention rate and $2 ARPU generates meaningfully more lifetime revenue than one with 5% retention and $4 ARPU - simply because there are three times as many users still active.
Churn is the mirror image
Churn rate and retention rate are inverses. If your 30-day retention is 10%, your 30-day churn is 90%. But here's where it gets tricky for mobile apps: measuring churn by uninstalls misses the bigger problem. Many users go dormant without ever uninstalling. They're technically "there" but generating zero engagement, zero revenue, and zero referrals.
This is why measuring retention through active engagement - not just absence of uninstalls - gives you a much more honest picture of your app's health.
App retention benchmarks by industry
Not all apps are created equal when it comes to retention. A social networking app and a food delivery app serve fundamentally different use cases, and their retention curves reflect that.
Here's what current mobile app retention benchmarks look like across major verticals, based on data from AppsFlyer (2025), UXCam (2026), and Statista:
App retention benchmarks by industry: Day 1, Day 7, and Day 30 retention rate ranges across 8 verticals.
Vertical
Day 1
Day 7
Day 30
Social & communication
30–35%
18–22%
15–20%
Fintech & banking
22–26%
14–18%
10–15%
Health & fitness
22–25%
12–16%
8–12%
Media & entertainment
22–27%
14–17%
8–12%
Gaming
25–30%
10–14%
4–8%
Ecommerce & retail
18–22%
10–13%
3–6%
Food & drink
16–20%
The cross-category median Day 30 retention is around 4% (UXCam, 2026). That's the floor most teams are competing against. If you're above 10% at Day 30, you're outperforming the vast majority of apps. Above 15%, you're in elite territory.
What these numbers actually mean for you
Benchmarks are useful as a sanity check, not as targets. A niche B2B tool with 12% Day 30 retention might be performing exceptionally well for its category, while a social app at the same number is underperforming.
The more useful question is: where is your retention curve steepest? If you're losing 60% of users between Day 1 and Day 7, that's an onboarding problem. If Day 7 to Day 30 sees the biggest drop, users are finding initial value but not enough to build a habit.
iOS vs. Android retention differences
Retention rates also vary by platform, and the gap is consistent across most verticals. iOS apps tend to retain users at slightly higher rates than Android apps at every interval. Industry data from Pushwoosh (2025) shows Day 7 retention averaging around 6.9% on iOS compared to 5.2% on Android, with the gap persisting at Day 30 (roughly 3.1% iOS vs. 2.8% Android).
Why the difference? Several factors contribute. iOS users tend to skew toward higher-income demographics who are more likely to pay for apps and invest time in them. The iOS ecosystem also has stricter app quality standards, which means fewer low-quality apps competing for attention. And notification behavior differs: Android gives users more granular control over notifications, which can lead to higher opt-out rates for poorly targeted messages.
If your app serves both platforms, segment your retention data by OS. A single blended number can mask meaningful differences in user behavior and help you prioritize platform-specific improvements.
Regional patterns
Retention also varies by geography. Apps in North America and Western Europe tend to report slightly higher Day 30 retention than those in Asia-Pacific and Latin America, partly due to device quality differences and partly due to market saturation dynamics. If your app serves a global audience, segment your retention data by region - a single global number can mask very different user experiences.
App retention strategies that actually work
Knowing your numbers is step one. Moving them is step two. These eight app retention strategies are where the highest-performing apps focus their efforts.
1. Optimize onboarding for time-to-value
Onboarding is your highest-leverage retention moment. According to industry data, apps that get users to a core value action within the first session see Day 7 retention rates 2-3x higher than those that don't (AppsFlyer, 2025).
Your onboarding should answer one question as fast as possible: "What's in it for me?" A music app needs users hearing their favorite song within 60 seconds. A project management tool needs them creating their first task. The longer the gap between download and "aha moment," the steeper your Day 1 drop-off.
Practical steps:
Map your "aha moment" - the first action that correlates with long-term retention
Strip the onboarding flow of anything that doesn't lead directly to that moment
Use progressive disclosure: collect information over multiple sessions, not all upfront
With a platform like Appcues, you can build onboarding checklists, tooltips, and welcome flows targeted to specific user segments - so a returning user from a trial campaign sees a different first experience than someone who found you through the app store. Appcues AI can even generate onboarding flows from a simple prompt, getting you from idea to live experience in minutes.
2. Personalize user experiences by segment
One-size-fits-all engagement is a retention killer. Users who downloaded your app for Feature A don't care about a push notification promoting Feature B.
Behavioral segmentation lets you deliver the right message to the right user at the right time. That might mean:
Showing power users advanced features they haven't discovered yet
Nudging trial users toward the activation milestone most correlated with conversion
Re-engaging dormant users with a message referencing their last meaningful action
The key is connecting behavioral signals to targeted experiences. When a user triggers (or fails to trigger) a specific action, that's your cue to intervene - not three weeks later when they've already churned. Appcues AI surfaces segment-specific recommendations based on user behavior, so your team can act on the right signals without manually sifting through data.
Netflix is a well-known example: their recommendation engine personalizes the home screen for every user based on viewing history, and the company has attributed roughly 80% of content watched to algorithmic recommendations. On the retention side, that personalization keeps users engaged session after session. Even if your app isn't Netflix-scale, the principle holds: apps that tailor the experience to individual behavior see measurably higher Day 7 and Day 30 retention than those that serve a generic interface (AppsFlyer, 2025).
3. Use push notifications strategically (not aggressively)
Push notifications remain one of the most effective re-engagement channels when used well. Apps that send segmented, personalized push notifications see significantly higher open and retention rates than those that blast generic messages to their entire user base (Airship, 2026).
But the margin for error is razor-thin. Overdo it and users will either mute notifications or uninstall outright. A 2024 study found that 32% of users who felt they received too many notifications disabled them entirely, and another 7% uninstalled the app (Storyly, 2024).
The sweet spot:
Time notifications based on individual usage patterns, not a company-wide schedule
Personalize the content - reference specific actions, progress, or interests
A/B test frequency and messaging - what feels right to your team might feel aggressive to users
Always give users control over notification preferences
For more on getting push notification strategy right, see our guide to the key ingredients of successful push notifications.
4. Leverage in-app messaging at the right moments
In-app messages catch users when they're already engaged, making them inherently less intrusive than push notifications. They're ideal for:
Announcing new features to users who'd benefit from them
Guiding users through a complex workflow with contextual tips
Celebrating milestones (completed onboarding, hit a streak, reached a goal)
The format matters. A full-screen modal for a minor update will annoy users. A subtle tooltip pointing to a new feature they've been looking for feels helpful. Match the message importance to the UI pattern: hotspots for discovery, slideouts for tips, and modals for high-impact announcements.
5. Track retention with cohort analysis, not just averages
Your aggregate retention rate can look stable while hiding serious problems underneath. Cohort analysis lets you compare how different groups of users retain over time - by sign-up week, acquisition channel, plan type, or any behavioral segment.
When you can see that users acquired through paid social retain at half the rate of organic users, or that users who complete the onboarding checklist retain 3x better, you have actionable intelligence - not just a dashboard number.
Start simple: compare weekly sign-up cohorts over 30 days. Look for inflection points where retention diverges. Then dig into what's different about the cohorts that stick. Amplitude's 2024 Product Report found that teams using cohort-based retention analysis identified the root cause of churn 40% faster than those relying on aggregate metrics alone.
6. Segment and re-engage at-risk users early
Most retention strategies kick in too late. By the time a user has been inactive for 30 days, they're effectively gone. The window for re-engagement is much shorter - typically 3-7 days of inactivity.
Build at-risk segments based on behavioral signals:
Users who haven't completed onboarding after 48 hours
Previously active users who've gone quiet for 5+ days
Users who visited a key feature but didn't convert
Then trigger targeted re-engagement: an in-app message when they return, a push notification with a specific reason to come back, or an email with a personalized prompt tied to their last action. The more specific the re-engagement, the higher the return rate. According to Airship's 2026 benchmark report, apps that trigger re-engagement messages within 3 days of inactivity see return rates 2-3x higher than those that wait a week or more.
Appcues connects these behavioral signals to targeted in-app experiences - so your team can move from identifying an at-risk segment to launching a re-engagement flow without waiting on engineers.
7. Build habit loops with variable rewards
The apps with the strongest retention curves don't just deliver value - they build habits. And habits form when users encounter a trigger, take an action, and receive a reward that motivates them to repeat the cycle.
Variable rewards are especially powerful. Instead of the same congratulations screen every time, mix in unexpected elements: progress badges, streak bonuses, personalized recommendations, or social recognition. The unpredictability keeps users curious and engaged.
You don't need to turn your B2B app into a game. Even small habit reinforcements - a weekly progress summary, a "you're in the top 10% of users" nudge, or a personalized "here's what you missed" message - can meaningfully shift the retention curve. Duolingo is the clearest proof: their streak and XP system drove a 36% year-over-year increase in daily active users through 2025 (StriveCloud, 2026). We'll dig deeper into their approach in the examples section below.
8. Set micro-retention checkpoints at Day 1, Day 3, and Day 7
Instead of waiting until Day 30 to evaluate retention, set specific engagement goals for the critical first week. Each checkpoint maps a measurable action to a time window, giving your team clear signals to act on.
Day 1: Reach the first value moment. The user should complete onboarding and experience your core feature at least once. If they haven't by end of day, trigger a welcome-back tooltip or push notification highlighting the quickest path to value.
Day 3: Return for a second session. A user who comes back on Day 3 has shown intent beyond curiosity. Use this window to introduce a secondary feature or invite them to customize their experience. If they haven't returned, a well-timed push or email referencing their first session can pull them back.
Day 7: Establish a usage pattern. By the end of the first week, retained users should be developing a rhythm. Reinforce it with a progress recap, a streak nudge, or a personalized recommendation based on their activity so far.
The power of micro-checkpoints is that they turn retention from a lagging indicator into an actionable, real-time process. With Appcues, you can set up event-triggered flows for each checkpoint, so the right message fires at the right moment without manual intervention.
Common mistakes that hurt app retention
Even teams that invest in retention make these errors. Recognizing them early saves months of wasted effort.
1. Treating all churn the same
A user who churned after one session is a completely different problem from someone who used your app daily for three months and then stopped. Lumping them into one "churned users" bucket means your re-engagement strategies end up too generic to work for either group. Amplitude's 2024 Product Report found that teams who segmented churn by lifecycle stage recovered 2x more users than those running a single win-back campaign. Segment your churn and address each group with a tailored approach.
2. Over-relying on push notifications
Push notifications are powerful in moderation and destructive in excess. If your primary retention strategy is "send more notifications," you're borrowing from your future engagement to pay for today's numbers. As noted earlier, 32% of users who feel over-notified disable notifications entirely (Storyly, 2024). Watch your notification opt-out rates as closely as your open rates.
3. Ignoring onboarding drop-off
Industry benchmarks show that the average app loses 74% of users the day after install (Statista, 2025), and much of that drop happens during or right after onboarding. If users abandon your setup flow, your retention problem doesn't start at Day 7 - it starts at Day 0. Instrument your onboarding to track exactly where users drop off, then simplify and test aggressively. Every percentage point you recover in onboarding completion compounds through Day 7, Day 30, and beyond.
4. Measuring retention without defining "active"
"Monthly Active Users" means nothing if "active" means "opened the app for 0.5 seconds." Slack famously moved from tracking "sign-ups" to tracking "messages sent" as their core engagement metric, and the shift fundamentally changed how they diagnosed and addressed retention. Define engagement in terms of actions that correlate with value delivery and long-term retention. Then measure against that definition consistently.
5. Waiting too long to re-engage dormant users
A user who's been inactive for 48 hours is much more recoverable than one who hasn't opened your app in a month. Airship's 2026 benchmark data shows that re-engagement messages sent within 3 days of inactivity produce 2-3x higher return rates than those sent after a week. Build automated triggers for early-stage dormancy, not just long-term churn.
Real-world examples of retention done right
Duolingo: gamification as a retention engine
Duolingo is the most cited retention success story in mobile apps, and for good reason. Their streak mechanic - which tracks consecutive days of practice - became the backbone of a habit loop that drove a 36% year-over-year increase in daily active users through 2025 (StriveCloud, 2026). The company reduced churn from 47% in 2020 to 28% in core markets by layering streaks with leaderboards, XP rewards, and AI-personalized lesson paths.
What makes it work: the streak creates a commitment device (users don't want to break their streak), while variable rewards (bonus XP, surprise challenges, leaderboard movements) keep each session feeling slightly different. Product manager Zan Gilani has said that gamification is "the key to Duolingo's success" in keeping users motivated.
The takeaway for your app: You don't need Duolingo-level gamification. But even a simple progress tracker or streak mechanic tied to your core engagement action can create the "I don't want to lose this" motivation that brings users back tomorrow.
Spotify: personalized onboarding that hooks users fast
Spotify's onboarding is designed around one goal: get users listening to music they love within their first minute. New users immediately see genre and artist preferences, and Spotify's recommendation engine surfaces personalized playlists before the user has even finished setup.
The result: Spotify consistently reports Day 1 retention above 40% among new free-tier users, significantly above the media and entertainment category average of 22-27%. Their "Discover Weekly" and "Wrapped" features keep long-term engagement high by giving users fresh, personalized reasons to return.
The takeaway: Personalize the first experience. The faster you can show users content, features, or outcomes tailored to them - not to the "average user" - the stronger the hook.
Calm: re-engagement through behavioral triggers
Calm, the meditation and sleep app, uses behavioral signals to time its re-engagement perfectly. If a user who typically meditates in the morning skips a session, Calm sends a gentle push notification later that day - not a generic "come back" message, but one referencing their specific routine: "Your morning meditation is waiting."
This approach, combined with daily streaks and content refreshes, helped Calm maintain Day 30 retention rates well above the health and fitness average. Their team has spoken publicly about how segment-specific messaging outperforms batch-and-blast by 3-4x in re-engagement rates.
The takeaway: Generic re-engagement messages get ignored. Messages that reference a user's specific behavior and context feel helpful, not intrusive.
Slack: retention through redefining "active"
Slack's retention story starts with a measurement decision that changed everything. Early on, the team stopped tracking sign-ups and started tracking "messages sent" as their core engagement metric. That shift revealed which teams were actually getting value from the product and which were just kicking the tires.
By focusing on messages sent, Slack identified that teams who exchanged 2,000+ messages were almost never lost. So they redesigned onboarding to accelerate that milestone, prompting new workspaces to invite teammates, set up channels, and start conversations during the first session. The result: Slack's paid conversion rate from free teams climbed steadily, and the company consistently cited time-to-first-value as its most important growth lever.
The takeaway for SaaS and B2B apps: The right retention metric isn't "logged in." It's the action that proves your product delivered value. Find that action, then build your entire onboarding and engagement strategy around getting users there faster.
Key takeaways
Retention is the metric that makes your growth sustainable. Without it, acquisition is a leaky bucket.
Track Day 1, Day 7, and Day 30 retention to understand where your curve drops steepest - that's where to focus.
Use cohort analysis instead of aggregate numbers. The average can hide the insights that matter.
Onboarding is your highest-leverage retention moment. Get users to value fast or lose them.
Segment everything - your engagement, your re-engagement, your notifications. Generic messages underperform by a wide margin.
Build habit loops with variable rewards to make returning feel rewarding, not obligatory.
Re-engage early. A user inactive for 48 hours is recoverable. A user gone for 30 days usually isn't.
Set micro-retention checkpoints at Day 1, Day 3, and Day 7 to turn retention into an actionable, real-time process.
Next steps: Audit your current onboarding flow against your Day 1 retention rate. If less than 25% of users come back the day after install, that's your starting point. Then set up weekly cohort tracking so you can measure whether changes actually move the curve.
Improving your app retention rate starts with understanding where users drop off and why. From there, it's about delivering the right experience at the right moment - personalized onboarding, targeted messages, and smart re-engagement when engagement starts to fade.
Appcues is a customer engagement platform that helps growth and lifecycle teams do exactly that. Connect behavioral signals to in-app experiences, email, and push notifications - onboarding flows, feature announcements, re-engagement nudges - without waiting on engineering. The teams using Appcues move from identifying an at-risk segment to launching a targeted experience in minutes, not sprints.
Book a demo to see how Appcues can help you move the retention curve.
Facts & Questions
What is a good app retention rate?
How do you calculate app retention rate?
What is the difference between retention and churn?
What causes low app retention?
How do push notifications affect app retention?
How does retention differ between iOS and Android?
Ready to see what your journey could look like with Appcues?
See how your team can remove friction, move faster, and deliver experiences that are easy for users... and safe for your systems. We’ll walk through your workflows, your governance needs, and the outcomes that matter most to your business.
.png)