
.png)

[Editor's Note: We're excited to share this article from Women in Product, originally published on their blog.]
Eleanor Stribling, Sara Nofeliyan, and Karmel Elshinnawi share their approaches for developing a Metrics Strategy at your startup.
I’m at a startup and I’ve been asked to define the metrics strategy for our product. What questions should I be asking to define our metrics strategy and what tips can you share so I avoid the common pitfalls?
When you’re defining a metrics strategy for a startup, your three main challenges are Time, Resources, and Clarity.
As you define your strategy, it helps to keep these constraints in mind because you will have to make conscious trade-offs between them.
Understanding how the executive team and product leadership define success helps ensure that you identify product metrics that will resonate with them and help drive resource allocations and decision-making. Here are some questions you can ask them:
You will also need to understand what data is available, how easily that data can be retrieved, and what metrics can be derived. Engineers and/or data analysts should be able to help you answer these questions:
Together, the answers to these two sets of questions will help you decide how best to work within the constraints of time, resources, and clarity to arrive at a useful and workable metrics strategy.
If you need to document your plans, create a word processing doc or slide deck with the following headers:
You will need to work these measures into your product development process, ideally at the specification development stage. Not every initiative will drive every metric, but having a clear plan for how metrics are used at a high level will help you determine the specifics of each project.
All startups are different, but there are a few things you can do in almost every situation to make sure your metrics strategy has staying power:
Defining a metrics strategy may seem daunting, especially when you’re faced with the constraints of a startup environment. However, the process of defining the strategy is in itself a valuable exercise because it forces the executive, product, and engineering teams to come to a common understanding and get clear alignment on the company’s priorities, the business strategy, and the product roadmap. The metrics strategy is useful only if it helps you measure the things that actually matter.
I hope the process and tips I’ve outlined above help you define and execute your startup’s metrics strategy with confidence. Good luck!
A Metrics Strategy should start with the following components: a definition of success, a way to instrument your product, and a rubric for evaluating the product’s performance. I describe each step below so you can define a strategy from scratch, and close with a few pitfalls to avoid.
Use your company’s mission to guide the Why of what you’re doing, and use that guidance to inform What you’re trying to achieve. A clear understanding of the Why simplifies the task of defining success when you look at the behaviors and actions that can be tracked.
For example, if your company’s mission is to create a world with no stray dogs, then your key action is placing dogs in their forever homes. You can also try this sentence structure: We want to increase the adoption of (feature) to/by (x rate) because we know that users who adopt this are (y times) more likely to (receive z benefit that ties to our mission). This statement turns your key actions into a key performance indicator (KPI) that is specific, measurable, attainable, realistic, and timely (SMART).
Instrumenting, monitoring, and measuring your product’s KPIs is critical to your metrics strategy. To gauge your success in achieving the example mission to create a world without stray dogs, you want to have a measurable event for a pet’s adoption.
There could be a few key actions (or data about the actions) to measure — such as the start and completion of the adoption process or the total number of rescue dogs in a facility. Invest the time to instrument products, clearly defining what will be measured and how it will be tested, and create a common language around your KPIs that teams will use cross-functionally.
A share-out of product metrics is always useful, so make your metrics available to team members and stakeholders. Steer clear of lengthy emails or posts in Slack that individuals might miss. Instead, create standardized reports that you can point to during stand-ups, or use a single slide for your all-hands or any product review meeting. The key is to provide a venue for people to ask questions and stay informed.
Regular share-outs of any product output — whether it’s research, wireframes, or metrics — will help you leverage the perspectives and creativity of your full team by creating opportunities for people to react to things in their own way.
With a common language for what success means and with definitions for your key actions, you are likely to see trends in the data. Avoid the temptation to define success based on usage trends that have already surfaced. You can resist this temptation by creating your rubric, or your lens, to evaluate this information up front.
Your rubric should consist of a set of rates or aggregate values that are the closest representation of the means to achieve your mission. Ask questions like: ”Does it matter how many users do this or how many times a day users do this? Is it critical to our success that we have a certain critical mass of users adopt this feature? Or is a steady rate of adoption more important in the long term? Why is an ‘active’ cohort defined this way?” After you answer these questions, you can document a clear set of metrics that you will evaluate consistently before, during, and after product launches.
In this section, I share some common pitfalls that I’ve encountered — and that you should make an effort to avoid — as you define your metrics.
After you’ve gone through the exercise of aligning your metrics around the mission, instrumenting your platform, and evaluating the product’s performance, you should have an idea of where to begin with feature improvements.
At the end of the day, if your product isn’t serving the needs of its users, then it isn’t achieving its purpose. Your product will change, and sometimes this means you’ll need to iterate on your metrics strategy as well. The intuition you build by creating a metrics strategy is a muscle that can help you make day-to-day decisions, so embrace the iterations.
Good luck and I hope this helps you create a strong, defensible strategy to steer your team!
The best way to begin crafting your metrics strategy is to think about the big picture and identify the most important metrics for the customer, the product, and the company. With the wide availability of tools and software to collect and analyse data, it’s far too easy to collect data without a clear set of goals. By focusing on the big picture, we avoid that trap.
I recommend the following steps as you think about your metrics strategy:
North Star metrics are the key set of metrics that measure the success of your product. They provide a mechanism that (a) aligns the entire company on measures that define product success, and (b) communicates the company’s progress towards that goal.
When you define your North Star metrics, keep in mind that they can change over time. The task of defining these metrics is not a one-time exercise.
LinkedIn published a great example of setting North Star metrics that align with their product vision for the Endorsements feature. They describe how they had originally optimized and focused too much on one type of North Star metric (i.e., count metrics, such as total endorsements given, unique endorsers, and unique recipients) and missed defining metrics that assess how well the feature was achieving the product vision (i.e., metrics that measure the quality of the endorsements given).
To quote their paper: “Count metrics, when used exclusively as the North Star, might inform product decisions that harm user experience.”
To ensure that our North Star metrics do a comprehensive job of measuring the success of our product, we must align these metrics on important measurement categories.
While there are many different ways to achieve this alignment, I like to use the HEART framework, which was developed by a research team at Google. With this framework, you can be confident that you have the foundational elements of what you need to measure.
I find this article about UX metrics to be a great introduction to the HEART framework.
For example, if your North Star is getting people to log their workout sessions three times a week, then you might want to focus on Engagement and Task success.
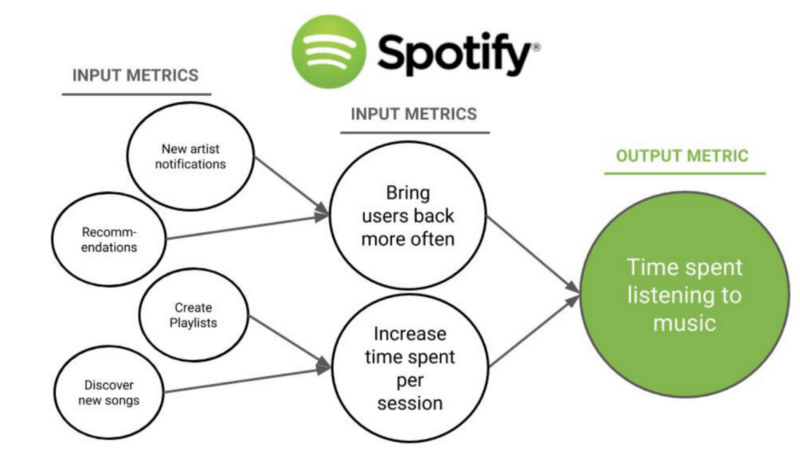
Think of your North Star metrics as the output metrics. Your input metrics are the actions needed to get to that outcome. To develop the input metrics, think about what people would have to do to produce the desired output metrics. The lowest level of input metrics should be something you can develop tests for and track progress against.
I find the illustration below to be very helpful in understanding the relationship between input and output metrics.
Now that you have an understanding of what you want to measure, you can start looking for the right tools. There are many tools available, so I recommend doing competitive research and think about the engineering effort needed to implement your metrics strategy. Some tools are developer heavy, some aren’t.
Things to consider as you search for tools:
Once you’ve selected a tool, you will most likely develop an analytics spec sheet to help your engineers measure the right things with the right triggers. A spec sheet is a way for you to communicate to the engineering team what you want to measure and why. Mixpanel offers a sample implementation tracking sheet that you can use as a starting point.
A Metrics Strategy is a perfect opportunity to get your team and the product aligned with the goals that are important to the business. If you start with the North Star alignment, you can get everyone working towards metrics that will give you a comprehensive understanding of your product’s user base. Keep in mind, this is an iterative process and your Metrics Strategy will continue to grow and evolve just as your product does.
. . .
Thank you to Rachel Bodnar for editing this piece and to Merci Victoria Grace for allowing us to share it.

.png)