.png)
A customer journey map is a visual representation of every interaction a customer has with your product, from first touch through long-term loyalty.
For SaaS teams, journey maps are most valuable after signup, where the gap between trial and activation determines whether users stick or churn.
This guide goes beyond the textbook definition to show how product, marketing, and CS teams use journey maps to reduce friction, drive adoption, and turn new signups into advocates.
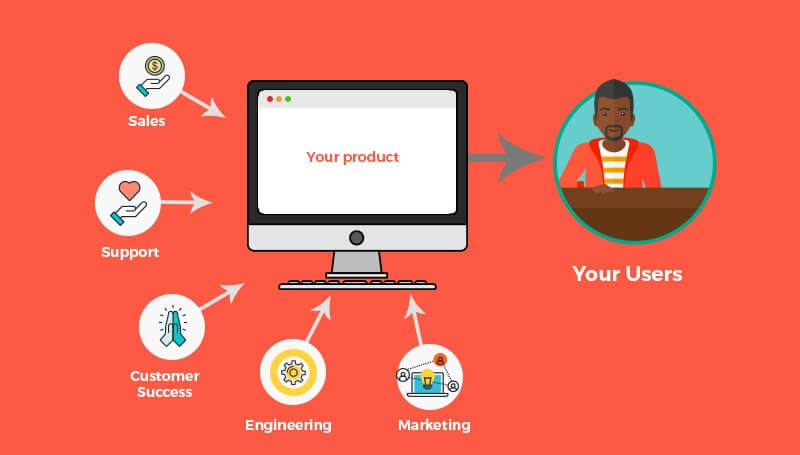
Here is a pattern that plays out at most SaaS companies: Marketing runs campaigns to drive signups while product builds onboarding flows based on what they think users need. Customer success reaches out when engagement drops. Everyone is working hard, but none of them are looking at the same picture of the customer's experience.
The result is activation rates that plateau, churn that spikes in the first 30 days, and support tickets about problems that could have been prevented with a well-timed tooltip or a clearer welcome email.
The root cause is rarely a bad product or a lazy team. It is a visibility problem. When each function optimizes its own slice of the customer experience, gaps appear at the handoffs. A user who just had a confusing onboarding experience gets a marketing email about an advanced feature they have never used. A trial user who hit a dead end on day two never hears from anyone until the trial expires. McKinsey's research on the consumer decision journey showed years ago that the traditional linear funnel fails to capture how customers actually make decisions. The same principle applies inside your product.
A customer journey map makes these gaps visible. It forces you to look at your product the way your customers actually experience it: not as a collection of features and emails, but as a sequence of moments that either build confidence or erode it.
This guide covers what a customer journey map actually is, what goes into one, the stages every SaaS journey includes, how to build one from real data, and where most teams go wrong. Whether you are building your first map or pressure-testing one that already exists, the goal is the same: replace assumptions with evidence, so you can meet customers where they actually are.
A customer journey map is a visual representation of every step a customer takes when interacting with your product or brand. It traces the path from first awareness (the moment someone realizes they have a problem your product could solve) through purchase, onboarding, ongoing use, and advocacy. Academic research on the customer journey confirms that this holistic, multi-stage view is essential for understanding modern customer behavior.
The key word is "customer's." A journey map is built from your user's point of view, not from your company's org chart. That distinction matters more than it sounds.
What a journey map is not:
For SaaS products, this distinction has real stakes. The most consequential stages of a software customer's journey, including onboarding, activation, feature adoption, and expansion, all happen after signup. Generic journey map frameworks that treat "purchase" as the finish line miss the part of the experience where SaaS companies win or lose customers.
A quick note on terminology: "customer journey map," "user journey map," and "buyer journey map" often get used interchangeably. In practice, a customer journey map covers the full lifecycle (including post-purchase), while a buyer journey map typically ends at the sale, and a user journey map focuses specifically on product interactions. For SaaS teams, "customer journey map" is usually the right scope because it captures the entire relationship.
Journey mapping is not a workshop exercise you do once and pin to the wall. When it is done well, it changes how your team makes decisions. Here is why it matters for SaaS specifically.
It aligns cross-functional teams around a shared reality. Product, marketing, CS, and sales typically optimize for their own metrics. Marketing tracks MQLs while product tracks feature adoption and CS tracks health scores. A journey map forces these teams to see how their work connects, and where users fall through the gaps between functions. Research on journey mapping for go-to-market alignment shows that companies using shared journey maps see measurably better cross-team coordination. When everyone is looking at the same picture of the customer's experience, prioritization conversations get simpler and faster.
It reveals friction that dashboards miss. Your analytics can tell you that 40% of trial users drop off during onboarding. A journey map helps you understand why. Maybe the user's emotional state shifts from excitement at signup to confusion when they hit a blank-slate screen with no guidance. That insight, the "why" behind the drop-off, only becomes visible when you map the journey from the customer's perspective.
It prioritizes investment. SaaS teams have limited engineering and design resources. Without a journey map, prioritization often defaults to whoever makes the loudest case. With one, you can identify the moments with the highest leverage: the touchpoints where a small improvement in experience creates a disproportionate improvement in activation, retention, or expansion. Harvard Business School's guide to journey mapping reinforces this point: the process itself forces teams to identify the moments that matter most.
It shifts focus from acquisition to retention. For SaaS businesses, the post-signup experience determines lifetime value. Journey maps naturally redirect attention toward adoption and advocacy, the stages where users decide whether to stay, expand, or leave.
If you think of your customer engagement strategy as a flywheel (moving from innovation to awareness to adoption to advocacy), journey mapping is the diagnostic tool that tells you where the flywheel is stuck and where it is spinning freely.
A journey map is only as useful as the information it captures. Here are the six components every effective map should include.
Customer personas. Who is taking this journey? For SaaS products, you likely have multiple personas following different paths through the same product. A buyer evaluating your pricing page has a different journey than an end user encountering your product for the first time, or an admin configuring integrations. Map one persona at a time. Trying to capture everyone on a single map creates a mess that helps no one.
Journey stages. The phases a customer moves through, from awareness to advocacy. (We cover the five SaaS-specific stages in the next section.) Each stage has distinct goals, behaviors, and emotional states.
Touchpoints and channels. Every interaction point between the customer and your company. For SaaS teams, this includes both marketing touchpoints (ads, landing pages, emails, webinars) and product touchpoints (onboarding checklists, in-app tooltips, feature prompts, upgrade modals, push notifications). The product touchpoints are where most SaaS journey maps add the most new insight, because they are often undocumented. For a deeper look at how to catalog and streamline these, see our guide to customer touchpoints.
Customer actions. What the customer actually does at each stage. Searches for a solution. Reads a comparison post. Signs up for a trial. Completes onboarding. Invites a teammate. Submits a support ticket. Specificity matters here: "uses the product" is not an action you can optimize. "Creates their first project and adds three tasks" is.
Emotions and pain points. What the customer feels and where they get stuck. This is the component most teams skip, and it is the one that generates the most actionable insights. A user who hits a blank-state screen in a project management tool is not just "inactive." They are confused, possibly frustrated, and one tab-close away from trying a competitor. Mapping emotions turns vague churn data into specific, fixable problems. A full customer experience mapping exercise can help you go deeper here.
Opportunities. Where you can intervene to improve the experience. Each pain point is a potential opportunity: a better welcome flow, a contextual tooltip, a proactive email, a simplified setup step. The best journey maps connect problems directly to potential solutions, so the map becomes a prioritization tool, not just a diagnostic one.
Every customer journey follows a general arc, but the specific stages look different for SaaS than for e-commerce or brick-and-mortar businesses. Here are the five stages that matter most for software products.
The customer recognizes they have a problem and starts looking for solutions. In SaaS, this happens through Google searches, peer recommendations on Slack or LinkedIn, review sites like G2 and Capterra, industry blogs, and social content.
Touchpoints to map: Blog posts, paid ads, social media mentions, podcast appearances, word-of-mouth triggers, review site listings.
The key insight for your journey map: by the time a prospect visits your website, they have usually already framed their problem and started forming opinions. Your awareness-stage touchpoints shape the lens through which they evaluate everything that follows.
The customer evaluates options and compares vendors. They visit your product page, read case studies, check your pricing, maybe sign up for a free trial or request a demo.
Touchpoints to map: Product pages, pricing page, case studies, demo requests, free trial signup, competitor comparison searches, sales conversations.
For SaaS, the consideration stage increasingly overlaps with the product itself. Product-led growth companies let prospects experience the product during evaluation, which means your in-product experience is a sales tool, even before a deal closes.
The customer commits. For product-led companies, this is often a freemium signup, not a sales-closed deal. The real "purchase" moment (the upgrade from free to paid) may happen weeks or months later, after the user has already experienced your product.
Touchpoints to map: Checkout or signup flow, welcome email, account creation, initial configuration, first login experience.
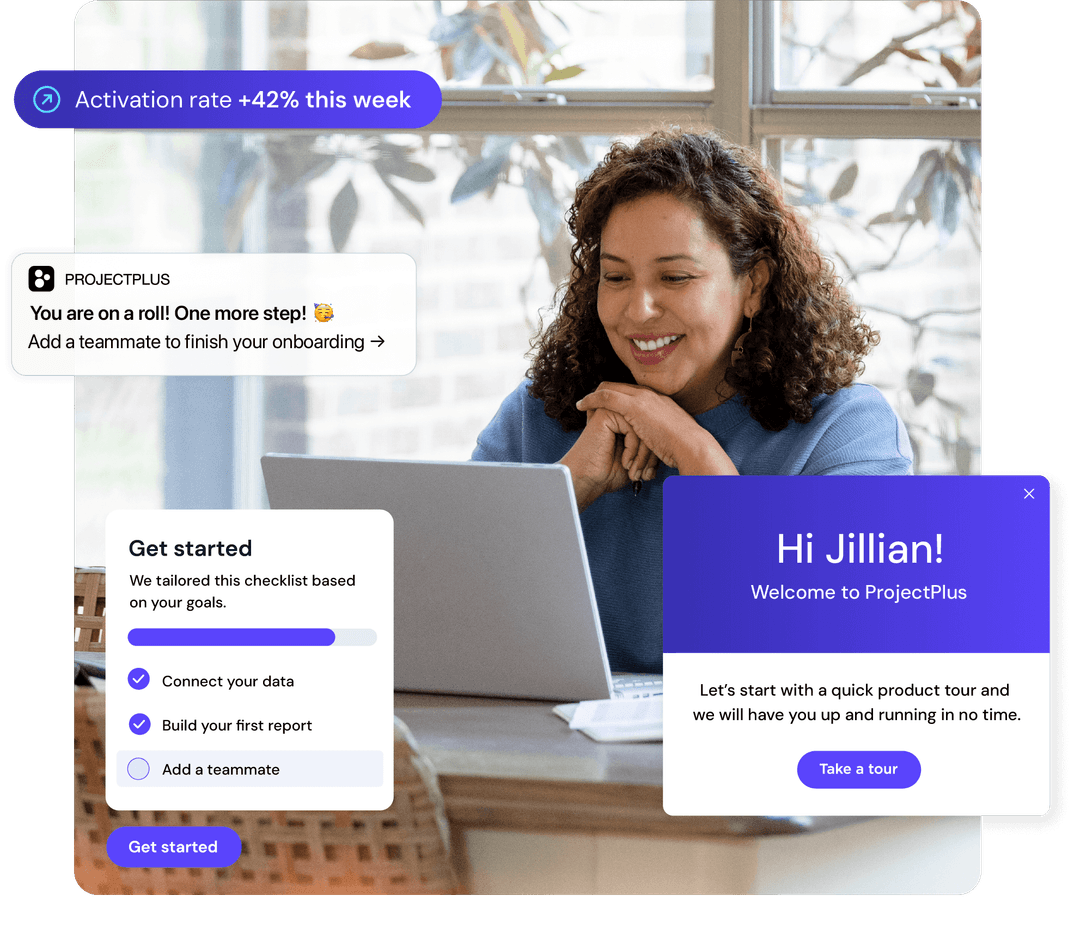
The customer learns your product and reaches their first value moment. This is the most important part of the customer journey for SaaS companies. The gap between signup and activation is where most churn happens. SaaS churn benchmarks consistently show that the majority of customer loss occurs in the first 90 days.
Touchpoints to map: Onboarding checklist, in-app guidance, product tours, setup wizards, activation milestones, first "aha" moment, help documentation.
Your map should capture what "activation" actually means for your product. For a project management tool, it might be "created a project and invited two teammates." For an analytics platform, it might be "connected a data source and viewed their first report." That specificity is what makes the map actionable. Shortening time to value is the single highest-leverage move most SaaS teams can make at this stage.
The customer stays, expands their usage, and (ideally) recommends your product to peers. Renewal decisions, feature expansion, NPS responses, and referrals all live in this stage.
Touchpoints to map: Health scores, usage milestone celebrations, upgrade prompts, feature announcements, referral programs, review requests, customer community engagement. For a broader look at how to keep users engaged across the full lifecycle, explore these customer engagement strategies.
This is where the journey loops back on itself. Advocates generate awareness for new prospects, which makes your journey less of a linear path and more of a flywheel.
You do not need a fancy tool or a two-day offsite to build a useful journey map. Here is a straightforward process.
Decide what journey you are mapping and for which persona. "The full customer lifecycle for our primary buyer persona" is a valid scope, but "the onboarding journey for self-serve trial users" is more actionable when you are starting out. Pick the journey that has the most obvious friction or the biggest business impact, and start there.
Use real data, not assumptions. Pull from support tickets, user interviews, product analytics, sales call notes, and NPS comments. Your persona should capture the customer's goals, their level of technical sophistication, what success looks like for them, and what would cause them to leave.
Catalog every interaction across marketing, product, sales, and support. For SaaS teams, the in-app touchpoints are often the least documented and the most important: modals, tooltips, onboarding checklists, banners, empty states, error messages, and push notifications. Walk through your own product as a new user. You will find touchpoints you forgot existed. Our guide to product onboarding walks through how to identify and optimize these in-app moments.
Walk through the journey from the customer's perspective. At each stage, document what they do, how they feel, and where they get stuck. Talk to real customers. Watch session recordings. Read support tickets from the past 90 days. The goal is to see the experience through their eyes, not yours.
For each pain point, brainstorm interventions. A confusing onboarding step might need an in-app tooltip. A post-trial silence might need a triggered email sequence. A feature that users never discover might need a contextual prompt. Prioritize by impact (how many users does this affect?) and effort (can you ship this in a week or does it require a product redesign?).
A journey map is not a deliverable you file away. Share it with product, marketing, CS, and sales. Use it in planning conversations. Update it when you launch a new feature, change your pricing, or see a significant shift in user behavior. The most useful maps are living documents that evolve with your product. Teams that revisit their maps quarterly tend to catch emerging friction points before they become churn drivers.
Common tools for building journey maps include Miro, FigJam, Lucidchart, and spreadsheets. The tool matters far less than the data and conversations behind it.
Journey mapping is straightforward in concept, but a few recurring mistakes undermine the effort.
Mapping from your org chart instead of the customer's perspective. This is the most common mistake. If your journey stages are "Marketing," "Sales," "Onboarding," and "Support," you have mapped your internal process, not your customer's experience. Flip the lens. Stages should describe what the customer is doing and feeling, not which department owns the interaction.
Stopping at purchase. Generic journey map frameworks often treat purchase as the destination. For SaaS, purchase (or signup) is closer to the starting line. If your map does not include onboarding, activation, feature adoption, and retention, it is missing the stages that determine whether your customer becomes a long-term user or a 30-day churn statistic. Data on average SaaS churn rates shows just how costly it is to ignore the post-purchase journey.
Relying on assumptions instead of data. It is tempting to build your journey map in a conference room based on what your team thinks the customer experience looks like. The problem: internal assumptions are almost always more optimistic than reality. Use product analytics, support ticket analysis, and user interviews to ground your map in what actually happens. Surveys are a start, but behavioral data should be the backbone. Tracking the right onboarding metrics and KPIs gives you a quantitative foundation for your map.
Making the map once and never updating it. Customer behavior changes. Your product changes. Your competitive landscape changes. A journey map from 12 months ago may reflect a product that no longer exists. Set a cadence (quarterly is a good starting point) for reviewing and updating your maps.
Over-complicating the map. A journey map with 47 stages, 200 touchpoints, and color-coded emotional arcs looks impressive on a wall, but no one will use it. Start simple. Map one persona through one journey with the six core components. Add complexity only when you have validated the basics and need more detail to make decisions.
To make this concrete, here is a simplified journey map for a fictional project management SaaS product. The persona is a marketing manager evaluating tools for her team.
StageTouchpointActionEmotionOpportunityAwarenessGoogle search: "best project management tool for marketing teams"Reads a comparison blog post, clicks through to product pageCurious, slightly overwhelmed by optionsEnsure comparison content highlights the specific use caseConsiderationProduct page, pricing page, G2 reviewsSigns up for a 14-day free trialCautiously optimisticRemove friction from trial signup (no credit card required)SignupWelcome email, first loginCreates an account, sees a blank dashboardExcited, then uncertain ("now what?")Provide an onboarding checklist with a clear first stepOnboardingIn-app onboarding flowCreates a first project, but does not invite teammatesEngaged but working soloTrigger an in-app prompt at hour 24 suggesting a team inviteActivation riskDay 3, no return visitReceives a "getting started" email, does not open itDistracted, losing momentumSend a push notification highlighting one specific feature relevant to their use caseAdoptionDay 7, returns after teammate invite promptInvites two teammates, creates a shared boardRelieved, starting to see valueCelebrate the milestone with a brief in-app messageRetentionDay 30, trial expiration approachingEvaluates whether to convert to paidWeighing value against costSurface usage stats showing team activity and time saved
The insight this map reveals: users who do not invite a teammate within 48 hours are significantly more likely to churn before the trial ends. The opportunity is a targeted in-app prompt at the 24-hour mark, rather than waiting for a generic email drip to run its course.
This is where customer journey maps become operational. The map does not just describe the experience. It points to a specific intervention at a specific moment, grounded in actual user behavior.
For teams that want to act on insights like these, a customer engagement platform like Appcues makes it possible to build and launch those in-app prompts, onboarding checklists, and milestone celebrations without waiting on engineering. The journey map tells you where to intervene; the platform gives you a way to do it.
A customer journey map is only as valuable as the actions it drives. If your map reveals that users need better guidance during onboarding, more contextual nudges during feature discovery, or a clearer path from trial to paid, the next step is building those experiences.
Book a demo to see how Appcues helps SaaS teams turn journey map insights into personalized in-app, email, and push experiences that meet users at the right moment.