
.png)
Product management has come a long way from “gut instinct.”
Before the introduction of cloud-based solutions, product managers had to mostly rely on what users reported. The underlying ask of a feature request had to be gleaned from user statements or requests that didn’t always get to the heart of the problem, either with UX or functionality.
Now, with 73% of companies saying that most of their apps will be SaaS by 2021, product managers have more information at their fingertips. It becomes a matter of leveraging access to that information through product analytics tools.
What does this mean for the role of the product manager? You’re now an “interpreter” of sorts, fulfilling four key duties:
Disparate systems or silos of information will cause a breakdown in your interpretation. Instead, you need a suite of products that will work together to provide actionable insights. In the cycle of product management, this in turn becomes your next set of raw data to interpret.
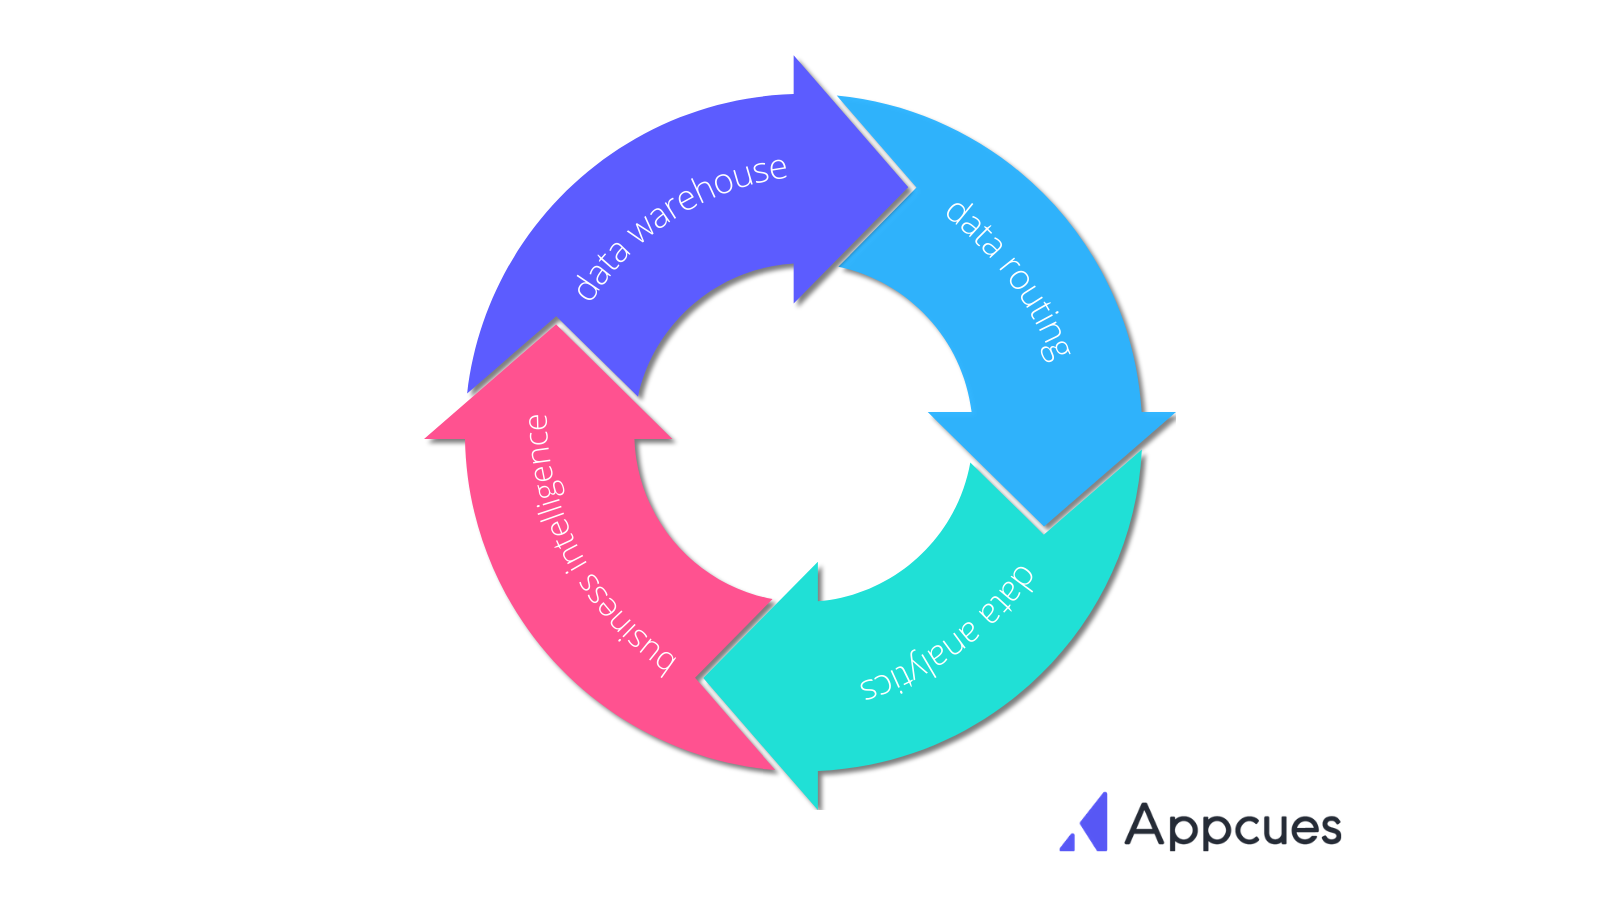
So what tools do you need in your PM tech stack? We’ll take a look at how a data warehouse, data routing tools, data analytics tools, and business intelligence tools work together to form a tight feedback loop and inform future product decisions.
Your data warehouse is your starting point in your product analytics stack. It is your centralized, single source of truth from where you draw information.
Your data warehouse is where you store your key information, such as the following:
Your data warehouse should continue to collect and store data over time for comparison.
But with all of this data collection and storage, it can become easy to amass so much data that it becomes a jumbled mess and unusable for product analytics. Amplitude talks in this article about how data management fundamentals include getting the maximum amount of value out of your data.
Going back to the interpreter analogy, think about what would happen if you needed to translate interviews from ten people... and they were all talking to you simultaneously. Likewise, you need to make sure that data is collected and organized in the cleanest way possible for your warehouse.
Snowplow, a behavioral data management platform, recommends the following considerations:
Just like an interviewer records responses, make sure you accurately collect data and organize it with a warehouse, so you can easily refer to it and move on to the next stage—translating.
The data warehouse is the foundation for your product analytics. You need to think about not only how you will use it today, but how you will build on that foundation with future needs. Features to consider include the following:
According to Snowplow, “ownership and control of data structure are cornerstones of successful, long-term data strategies and effective data governance.” Your company knows how this data will be put to use, and your data warehouse should reflect your specific needs.
If the data exists only in a data warehouse, it can’t give you the insights you need as a product manager. Your data needs to be accessible in other tools that allow you to interpret and use the data.
Sure, you could have a data analyst perform some complex queries against your data warehouse and pull the data into a spreadsheet or homegrown tool for your analytics. But there are specialized products on the market that are designed for sophisticated product analytics. These tools may also present you with findings that you may not have considered on your own.
Product analytics tools help PMs quickly form insights around their data. But to use these tools, your data needs to get from Point A (your data warehouse) to Point B (your product analytics tool). And in order for that to happen, you need a data routing tool: something that handles the movement between your data warehouse and other tools.
Think of your data routing tool like translating an interview. You’re not thinking about what your interviewee is telling you yet—you’re just getting the original interview to a place where you can make sense of it.
Ideally, this data routing process is hands-off. You use a tool that can extract the data from its original format in your data warehouse, transform it as needed, and load the data into your product analytics tools.
Data routing tools can also load data into your data warehouse from its original source. With this feature, routing is useful for both the collection of the data for your data warehouse and the translation of your data for your product analytics tools.
Moving data around should be the least of your problems. It should easily take information from your data warehouse and get it where it needs to go. A data routing tool should:
In the past, often these tools were known as ETL (extract, transform, load). In more recent years, this has often been known as “reverse ETL,” with the data warehouse at the epicenter, and routing tools serving as a powerful link to other tools.
Products like Census can automate the syncing process between your data warehouse and data analytics tools.
At this point, you have collected and translated your data. What’s next?
It’s time to look at your translated data from your routing tool and make sense of it with an analytics platform.
Translation is about more than taking words from one language and moving them into another language. That is certainly part of the process, but if it were that straightforward, then Google Translate should be sufficient to take a classic piece of literature from English to Mandarin. Instead, translation is very nuanced. You are taking the “words” and diving into the nuances and intent.
Product analytics tools take your data in its flat, translated format and give it context. They allow you to:
No one wants to build a product that no one will use. Data analytics take the guesswork out of product management and should guide your decision-making process. This lowers the risk when you build something new, because you have looked at your analytics, and you understand what the data is telling you.
Think back to your role as the interpreter. The analytics stage is like figuring out whether the interviews you’ve gathered support what you were expecting to hear, or tell you something completely different.
To make the most sense of your data, you need to outline a strategy for using data analytics tools. Your strategy is more than just an output of data in your data analytics tools: It is about identifying and prioritizing the outcome that you are expecting. The tools you select should support this effort, including:
While you may not have much direct interaction with the data warehouse or data routing tools, the data analytics tool may be where you become involved, so it should be a product that meets your needs.
While your data analytics tool will tell you where you are today, the next step of your product’s journey is taking those insights and determining where your product will go tomorrow.
After making sense of your interviewee’s stories, now it is up to you to determine the next steps. This is where your experience as a product manager guides those decisions so that you can propose, “Because we see x in our data analytics, we should take the route of y.”
Data analytics tools are key for pulling data insights—but they’re not always user-friendly for everyone at your company. They tend to be somewhat detailed, intended for users who are used to looking at and working with data.
But data needs to be accessible for company-wide decision-making to happen. You need both: the analytics and the business intelligence (Mixpanel breaks it down for you in this article). Say you want to launch a new feature, but customer churn is high. You may want to have your support team analyze ticket records so you can identify and address the reasons for churn first.
Business intelligence tools help make your data accessible for all employees. These platforms transform your data into easy-to-digest presentations. Armed with these, team members can form simple yet actionable insights from your data.
Your interviews, your translation, your understanding of the data... none of this will matter if others in your organization do not understand the implications. Business intelligence tools illustrate where you are today so that you can make decisions about where you should be in the future. Key features should include:
More than any other tool in product analytics, business intelligence tools should be designed for nontechnical users.
As your data makes its way through these tools, keep in mind that your role as the PM interpreter goes beyond the data itself. You are also the voice of the data (and customers) when you are talking to stakeholders.
Use the information you collect to support internal discussions. You might use data to answer the questions, “Are there issues to address in the existing product?” and “Is the product ready to move to the ‘next level’ of functionality?”
Your final step in the interpretation process is to help others in the organization understand the insights behind the data and make the best decisions possible for your product’s future.

.png)
%2520(1).png)