.png)
Net Promoter Score (NPS) is one of the most popular ways to measure customer loyalty and satisfaction. At Appcues, NPS is one of the metrics we use to understand high-level customer health trends as well as the long-term impact of our work. And lucky for us, in-app NPS surveys are one of our product’s core capabilities.
If you’re still a little unclear on this whole NPS thing, our comprehensive overview will help you get up to speed. But if you and NPS go way back, venture forth.
NPS isn’t new to Appcues. Our in-app NPS surveys have been trusted to collect nearly 2 million NPS responses this year alone. That’s a lot of feedback.
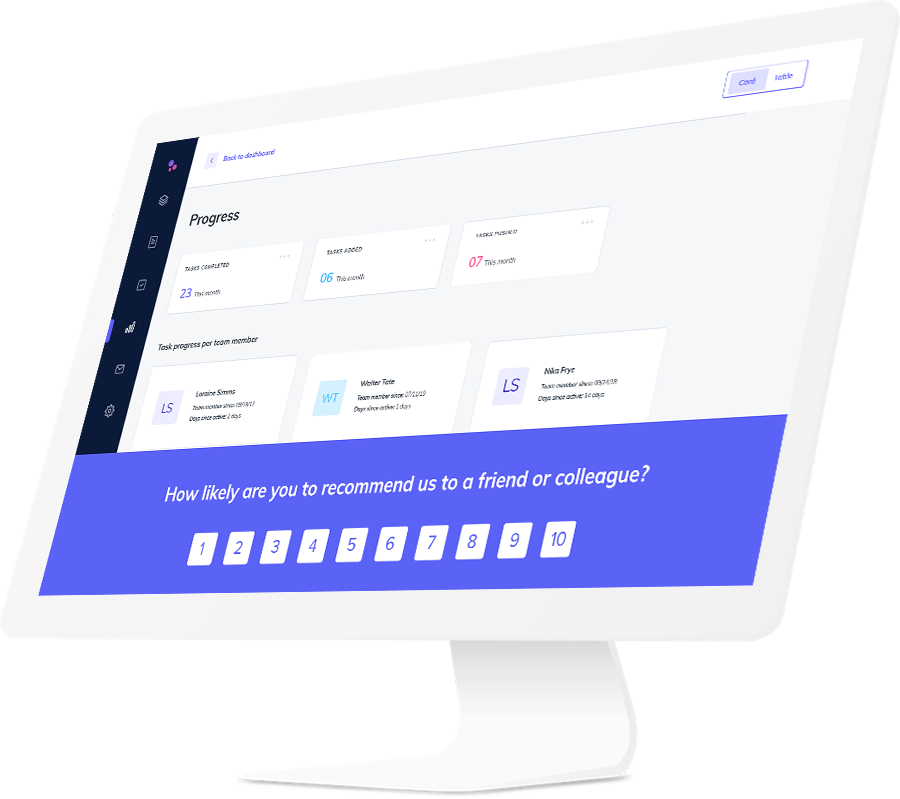
Compared to fielding NPS surveys via email, in-app NPS surveys typically perform far better—both in terms of response rate and quality of response. That’s because they ask the question in the right context, while customers are engaged in the product. Take LogMeIn for example: their in-app surveys increased overall response rates by 10x. 🤯
But collecting lots of high-quality NPS data is like buying 6 bags of potatoes. It’s what you do with the raw materials that matters most (twice-baked potatoes, duh).
Over the last year, our team has dramatically improved Appcues’ reporting and analytics capabilities throughout the product. From new and improved Flow analytics to our recent introduction of no-code event tracking and insights, we’ve got measurement on the mind.
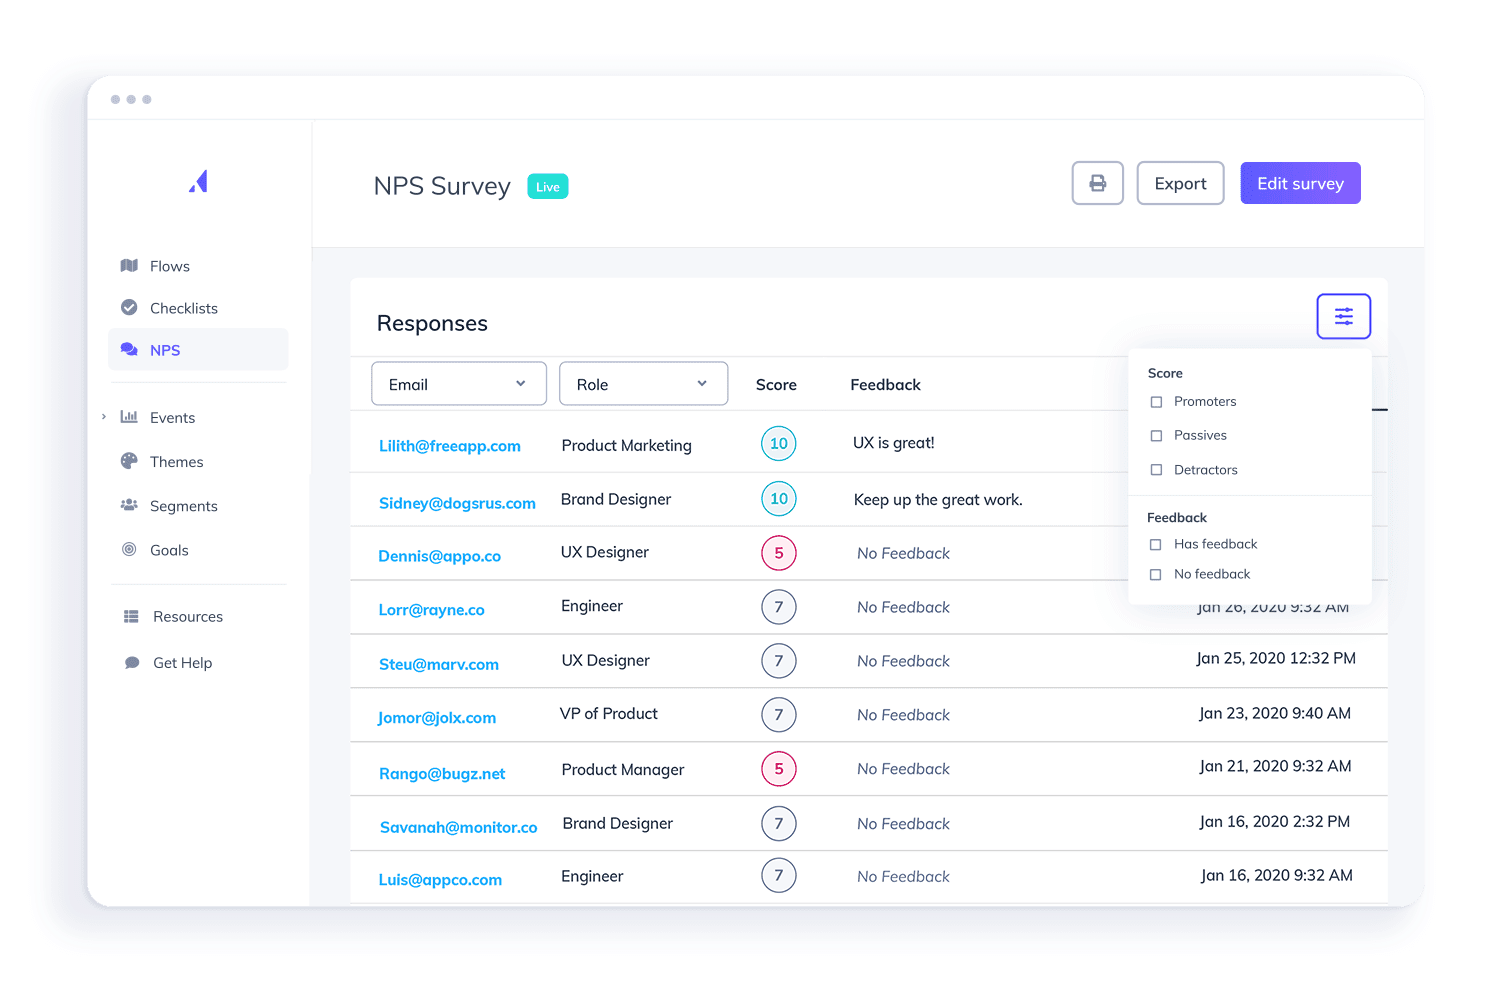
Our customers were hungry for more data, more graphs, more insights… and NPS reporting was no exception. (This is the part where you scroll down excitedly.)
Learning more about your users and sharing insights with your team just got a whole lot easier.
Our customers told us that they wanted to get more granular in their analysis of NPS responses. They wanted to see how their NPS score was trending over time. They wanted to segment responses to reveal the NPS for a specific group of users. They wanted to make phenomenal twice-baked potatoes.
And we listened.
Here’s a look into what we’ve been cookin’ up!
“Tiiiiiiiiiiiiime is on my side, yes it is.”
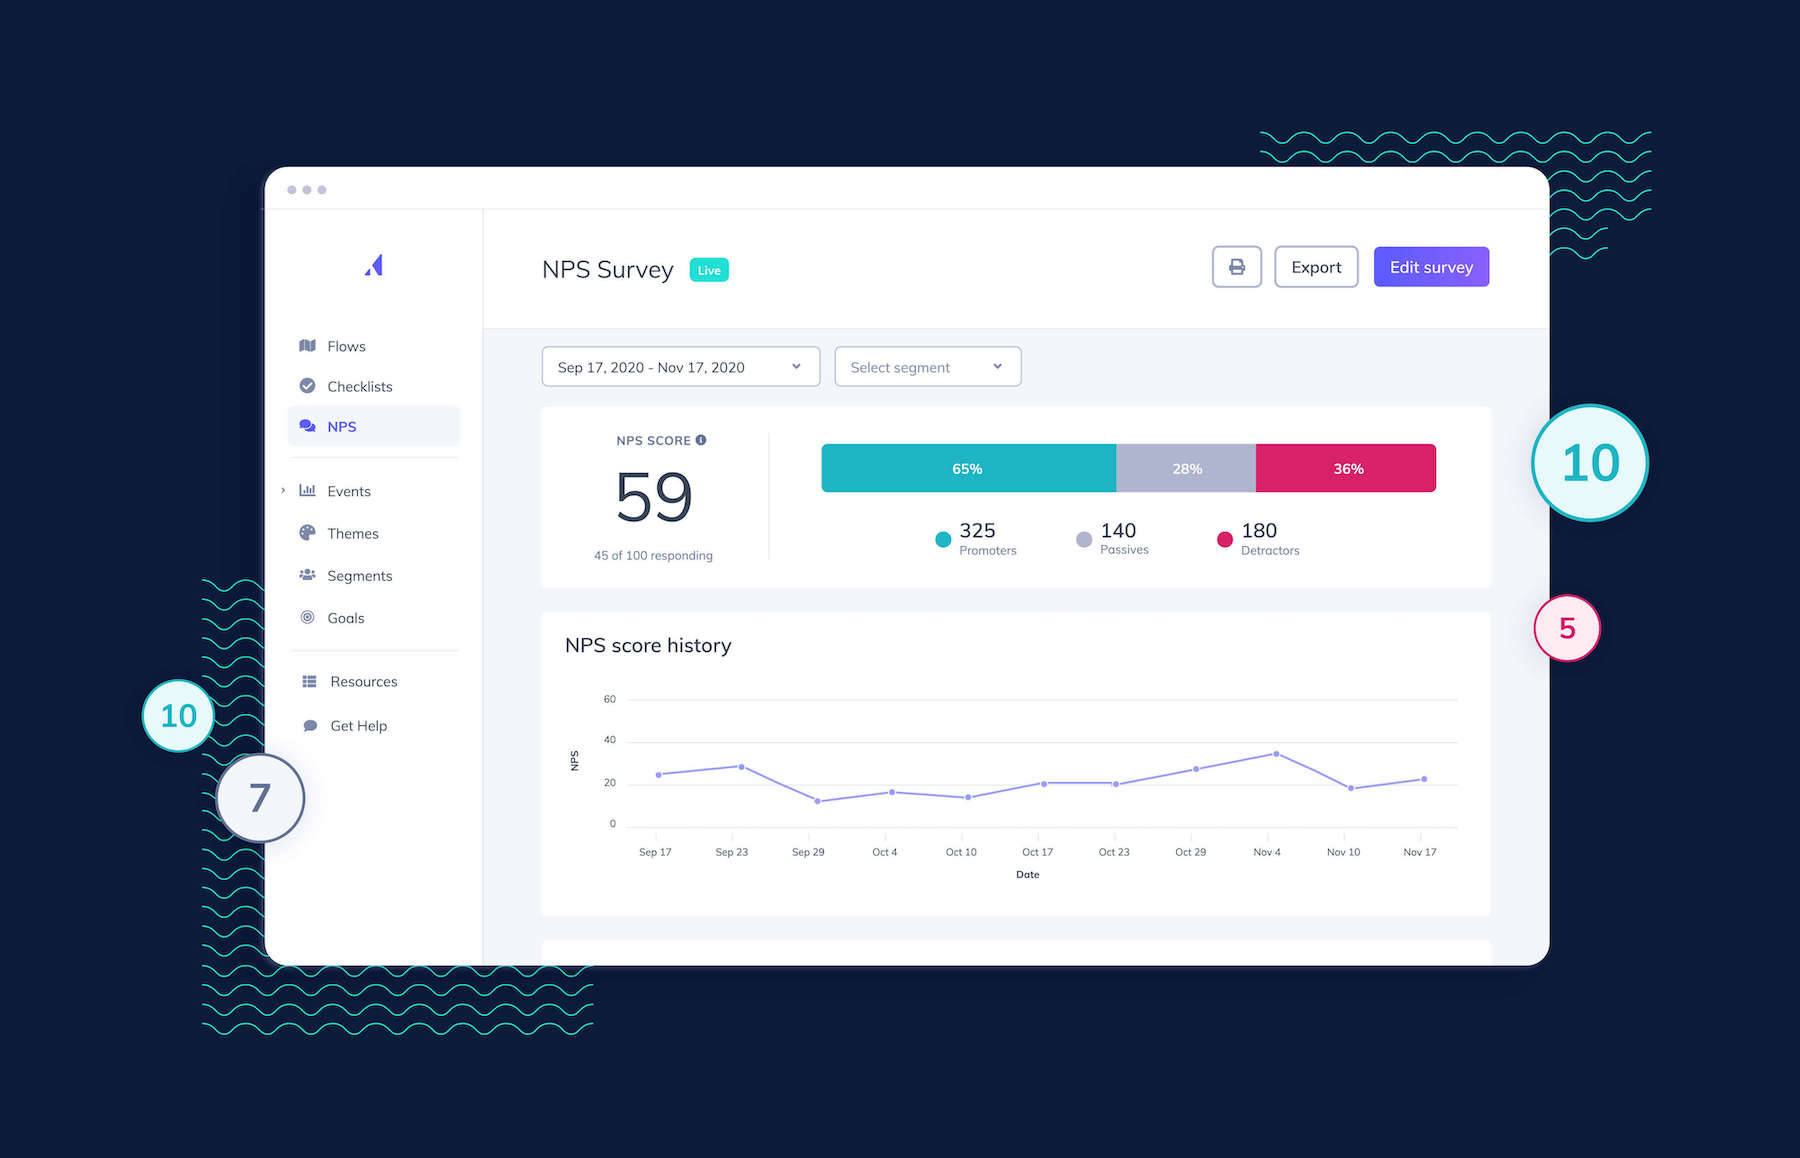
The NPS page now has a customizable date range. In other words, you’re no longer limited to the last 30 days. You can see NPS, respondents, viewers, and response rates all filtered by date. Note: each plan has its own limit for historical data.
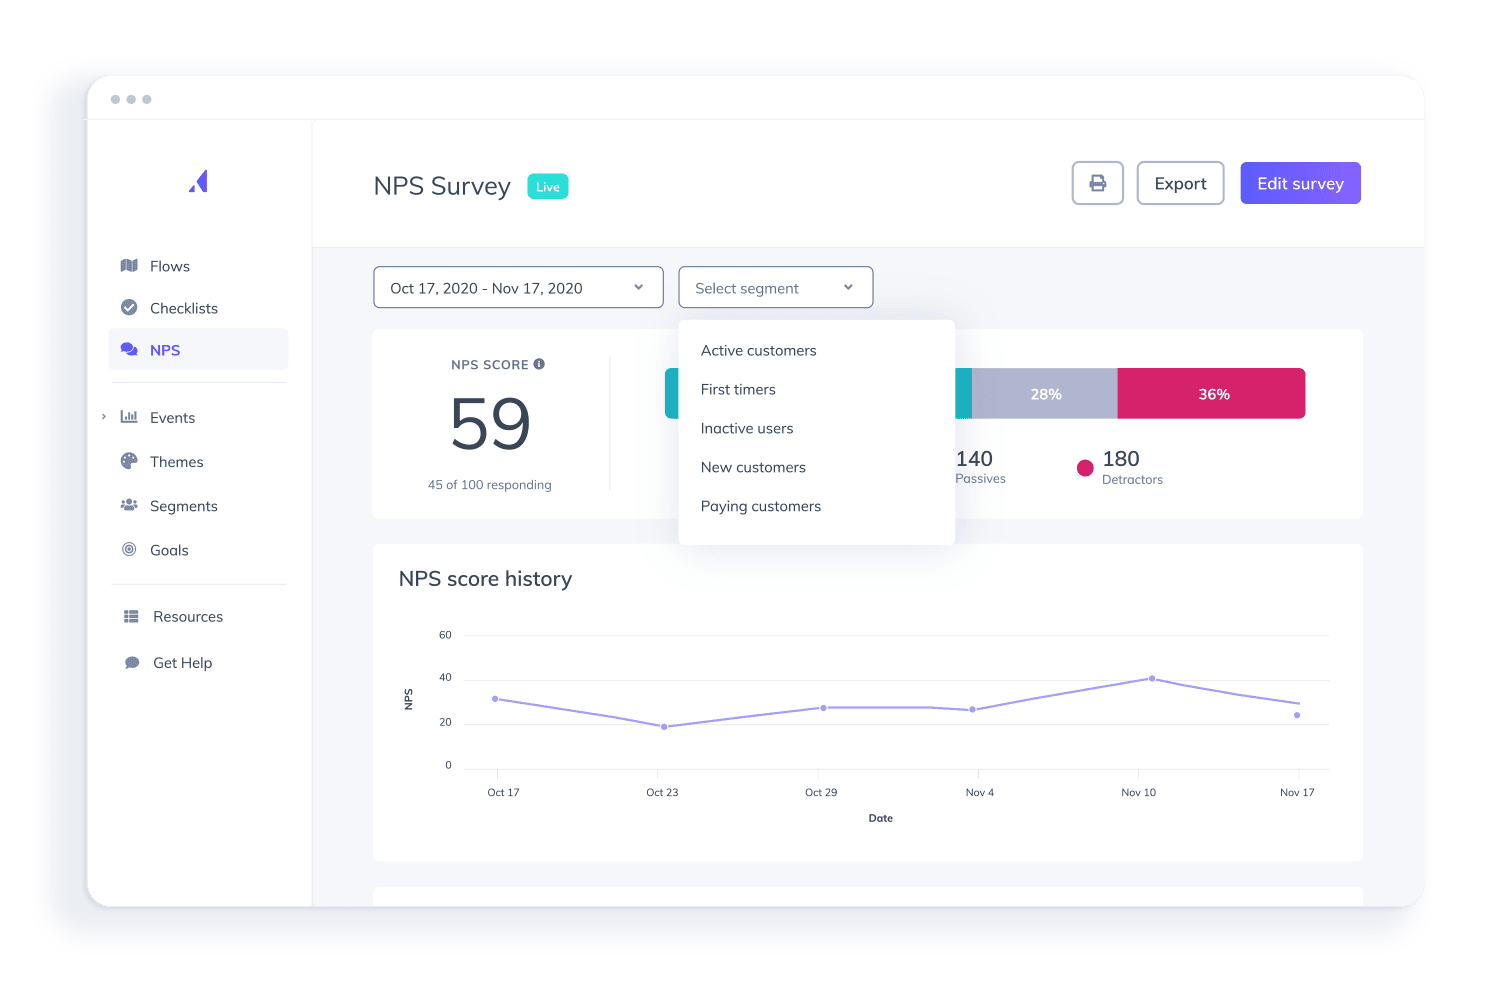
It’s time to slice and dice, my friends. NPS can now be filtered by segment (to show NPS for only users on a specific plan tier, for example)! From there, use additional filters to show only the folks that have feedback, only the detractor scores that include feedback, only the promoters and detractors… we could go on, but you probably get it by now.
Ready to show the team how things are going? Select any date range you please and create a convenient PDF report that’s perfect for emailing to your boss or printing out (if you still have a printer).
We know NPS sometimes gets a bad rap for being an oversimplification of user sentiment, but we see it as an important and accessible piece of the larger product analytics puzzle. Plus, it’s one of the only Appcues patterns that provides teams with immediate, actionable results.
But before you survey to your heart’s content, here are some quick tips to keep in mind:
As of today, Appcues’ new NPS analytics is live in every Appcues account. If you’re already an Appcues customer, log in to launch your first survey or dig deeper into your NPS data.
Not using Appcues yet? Sign up for a free trial to get started!


.png)