.png)
As a product person, it’s incredibly important that I understand a) who our customers are, b) what they’re trying to achieve, and c) how they’re using our product. Fortunately, I get the opportunity to learn more about a and b during my weekly customer calls, but c—how customers are tangibly using our product—is much, much harder.
Here’s how it usually goes down. I have a question about usage, like “how many people actually click that ‘learn more’ button?” So I look through our many tools to see if we’re tracking that data anywhere. After falling flat, I create a ticket for my team to set up tracking on the button. That hangs out in the backlog until there’s space in a sprint, and by the time it's delivered, I'm already 10 questions removed and onto another problem.
Sound familiar?
This scenario is all too common for our customers as well, which is why I’m incredibly excited about Appcues’ new click-to-track and Events Explorer features! Using these two hand-in-hand enables you to quickly track and analyze new events without leaving Appcues—and without the help of a developer. Armed with this information, you can then use Appcues experiences to take the next step; whether it be a survey to get more data, a flow to nudge a user towards action, or simply setting up a dashboard to monitor your data over time. After countless customer interviews, lots of brainstorming and ideation, testing, more testing, and development, we’ve created a simple yet powerful way to measure product adoption and user engagement.
Now I’m going to get a little meta. I’ll tell you about how I helped build a feature to easily track product engagement, then how I used that feature to track engagement with the feature itself during beta. Is your head spinning yet?
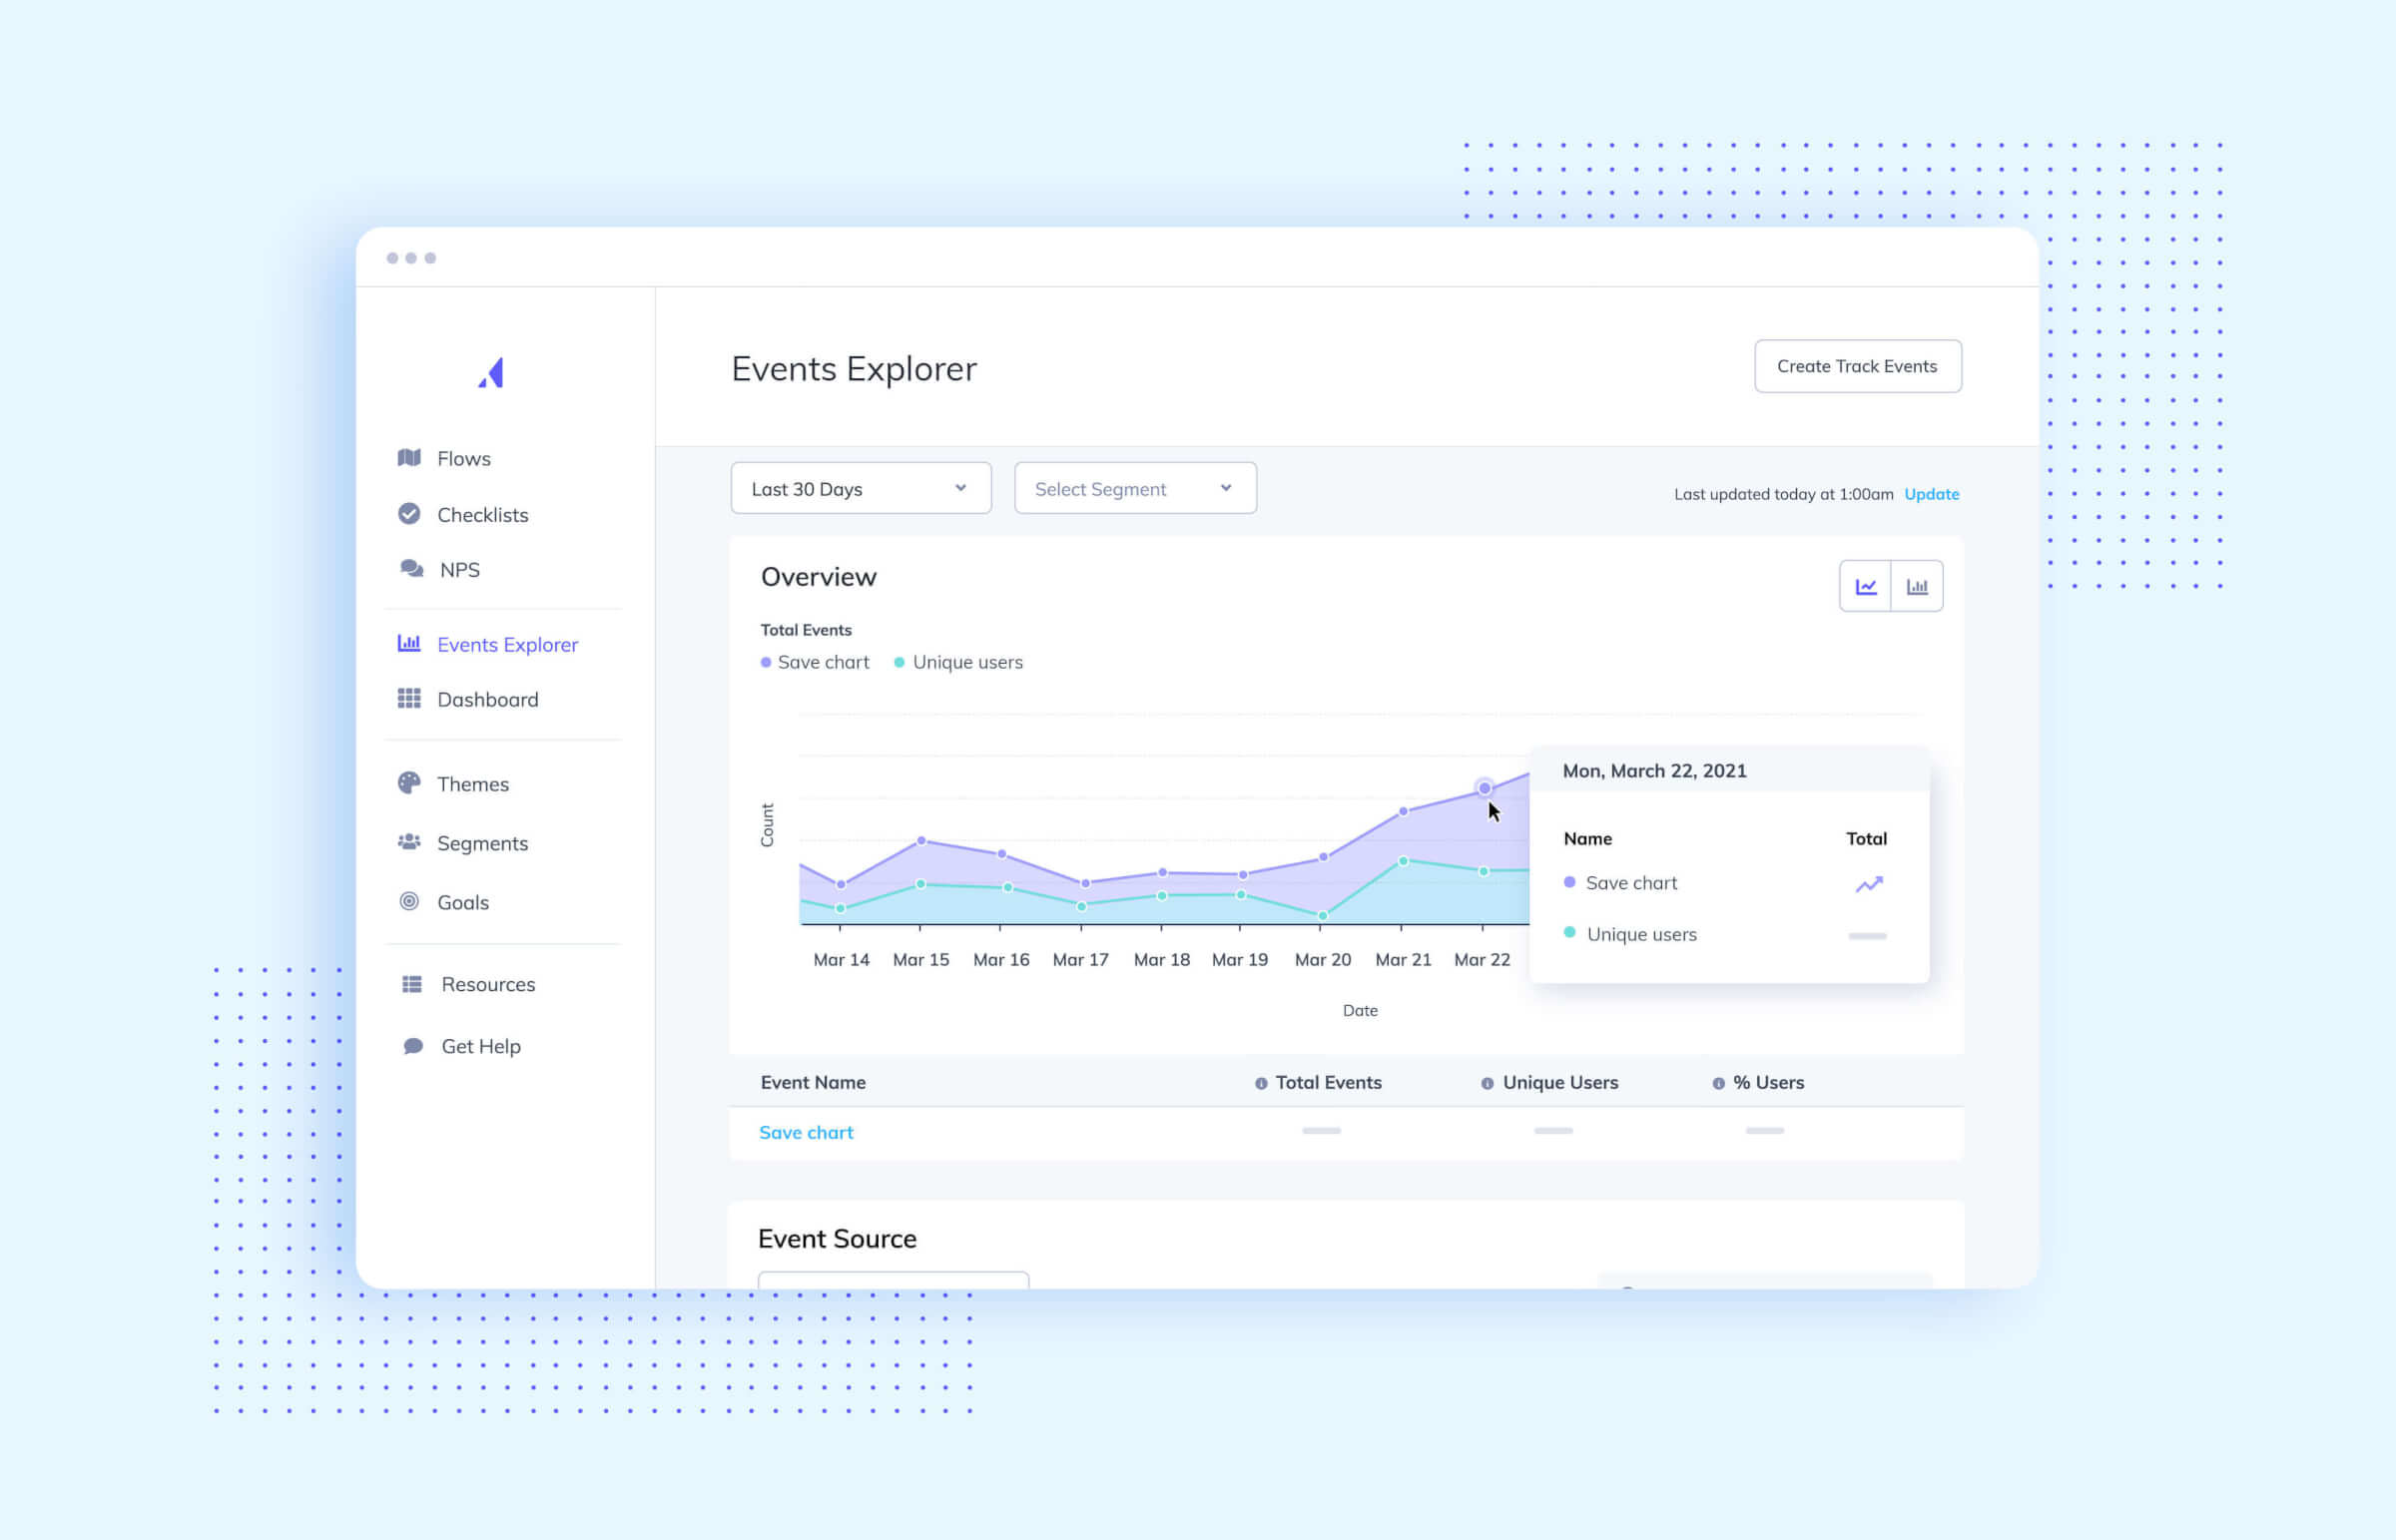
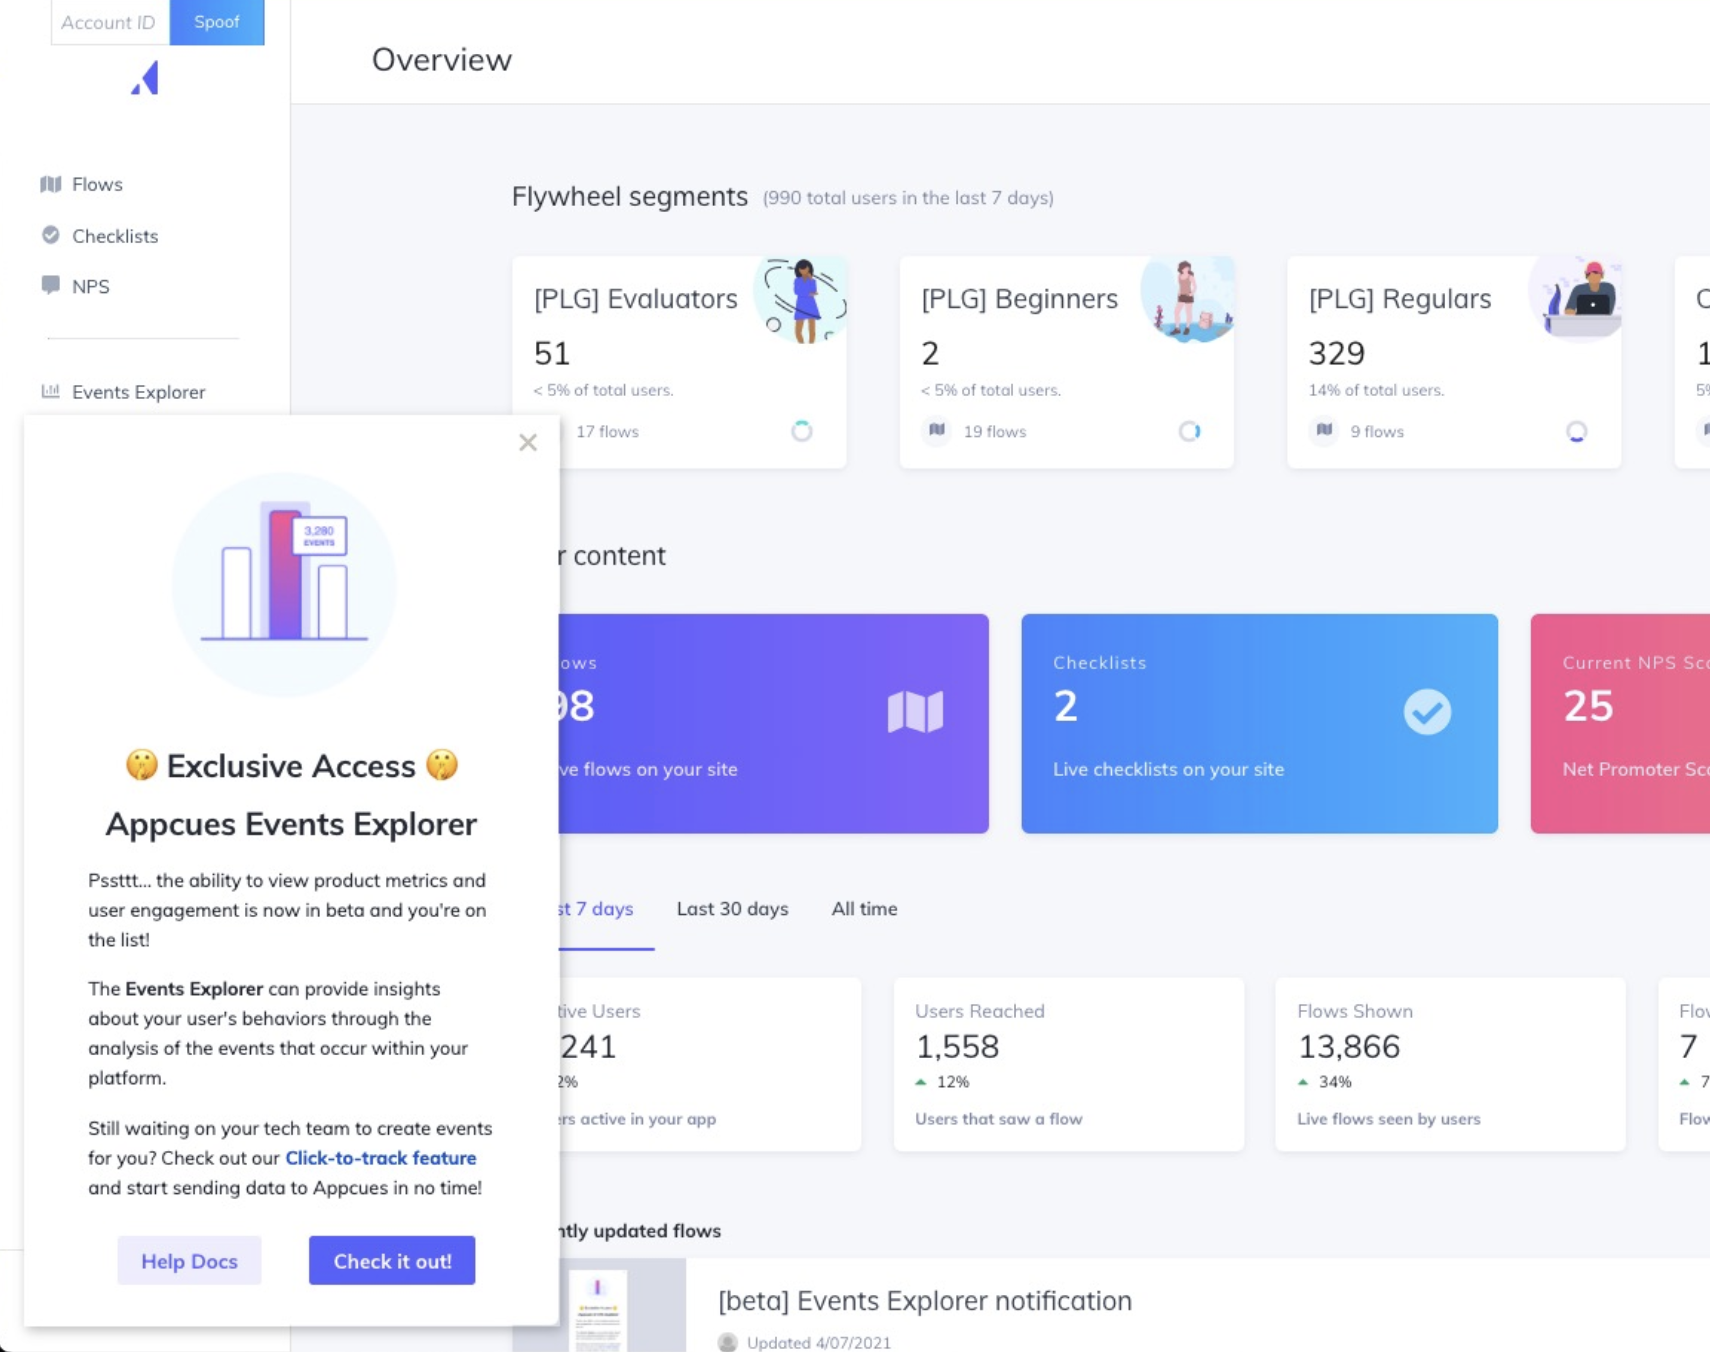
Before we release any new feature, we invite a limited number of users to try it out in beta. This time was no exception. Over 50 customers participated, including me (#dogfooding ftw)! Here’s how I prepared:
After about a week, there were a few surprises. Overall page visits were lower than I expected, despite sending an email to all 50 of our beta users. Those that did visit the page weren’t clicking the “Save Chart” button, which we’d identified as a KPI for this release. I needed a way to drive more page visits, and ultimately, more users to save their charts. Enter: Appcues flows! I created a slideout to announce beta access, targeting not only the users I’d already emailed as well as the other users on each of their accounts. I also created a short tooltip tour, pointing out the key components and ending with a CTA: save a chart.
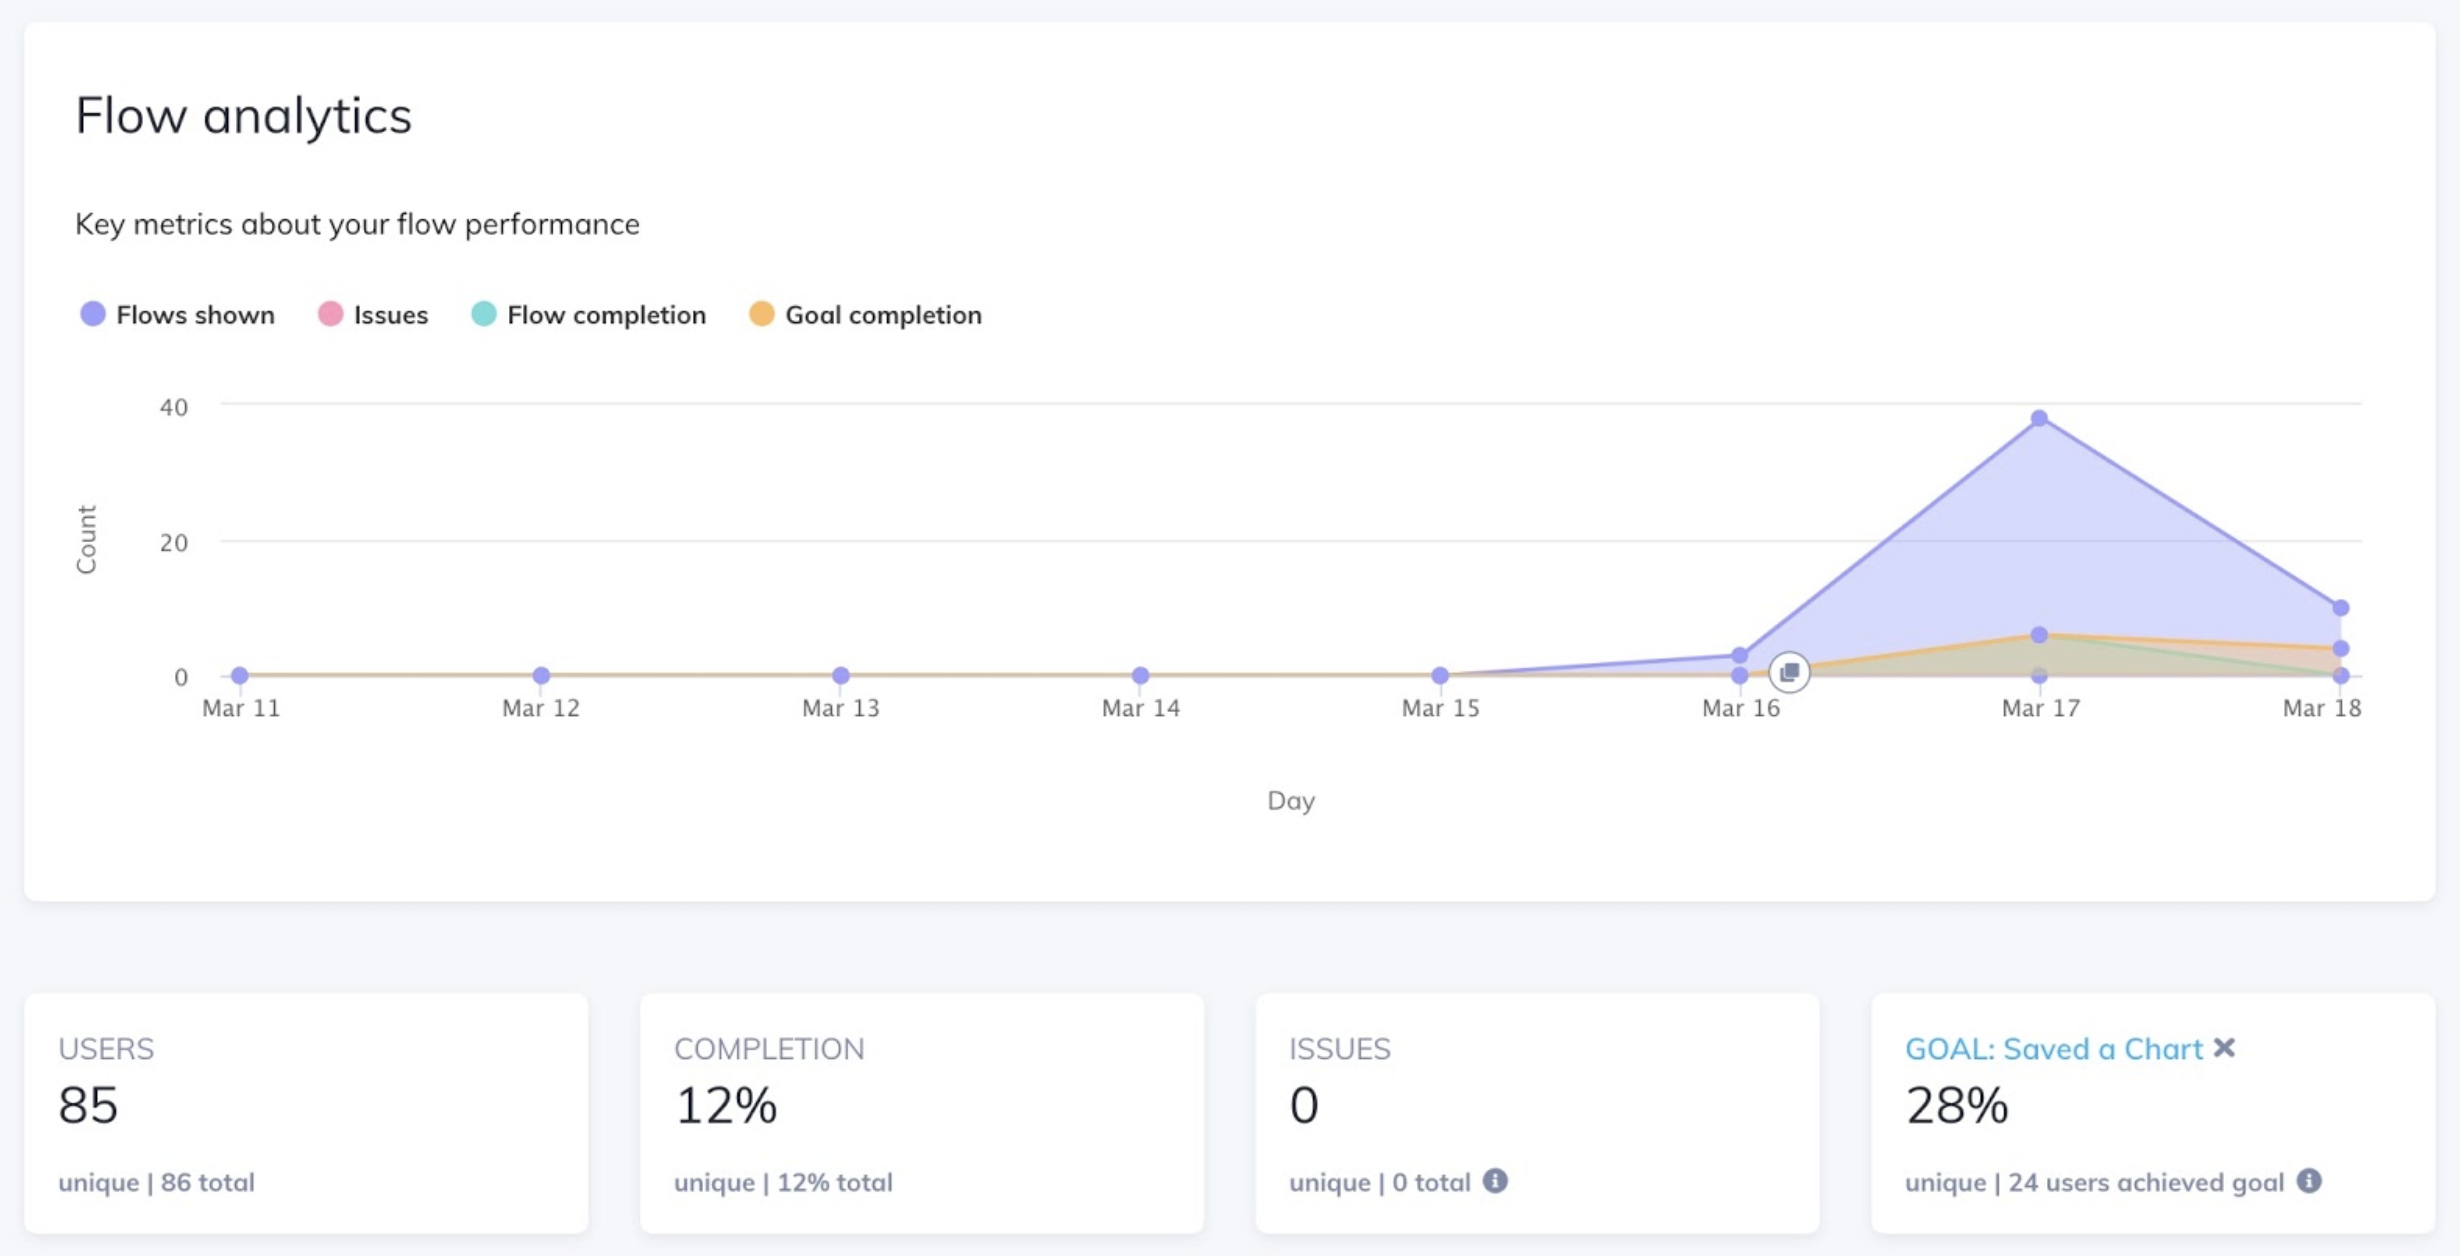
Lastly, I used the events I tracked earlier as the basis for a few new Goals. After only two days, I immediately saw the impact of my efforts. 28% of users who saw my slideout announcement and 45% of users who saw the tour went on to save a chart.
To recap, I used Appcues’ click-to-track feature to create new events without a developer, Events Explorer to create charts and monitor usage, and in-app flows to increase feature awareness and adoption. I was able to complete the entire build-measure-learn loop (one of my favorite frameworks) using Appcues alone. And that’s when I knew it was time to celebrate!
I hope that by sharing my experience using our new features, I can inspire you to do the same. After all, concrete use cases and stories are what bring a feature to life for me. Some of the ways I am thinking about using Appcues in the future include:
I’m curious, how do you plan to use click-to-track and Events Explorer? What are you dying to know about your product and users? If you’re already using the new features, I’d love to hear about your experience! What have you uncovered? Got feedback? Send it my way at lily@appcues.com.

.png)
%2520(1).png)