appcues ai
Plan better experiences, ship them faster, and learn what drives growth with AI that blends expertise with your real product data.
Start from what’s already proven to work
Turn ideas into live experiences, faster
Understand results clearly and know what to change
Available
Get expert guidance grounded in benchmarks and best practices across adoption, engagement, and more.
Available
Help understanding where and why experiences show, including targeting, URLs, and page elements.
Available
Translate who you want to reach into targeting logic, validate segmentation, and confirm the right audience.
BETA
Make ideas come to life faster with help creating, editing, and optimizing your experiences.
Available
Ask questions about performance, impact, and engagement to surface insights and ideas for improvement.
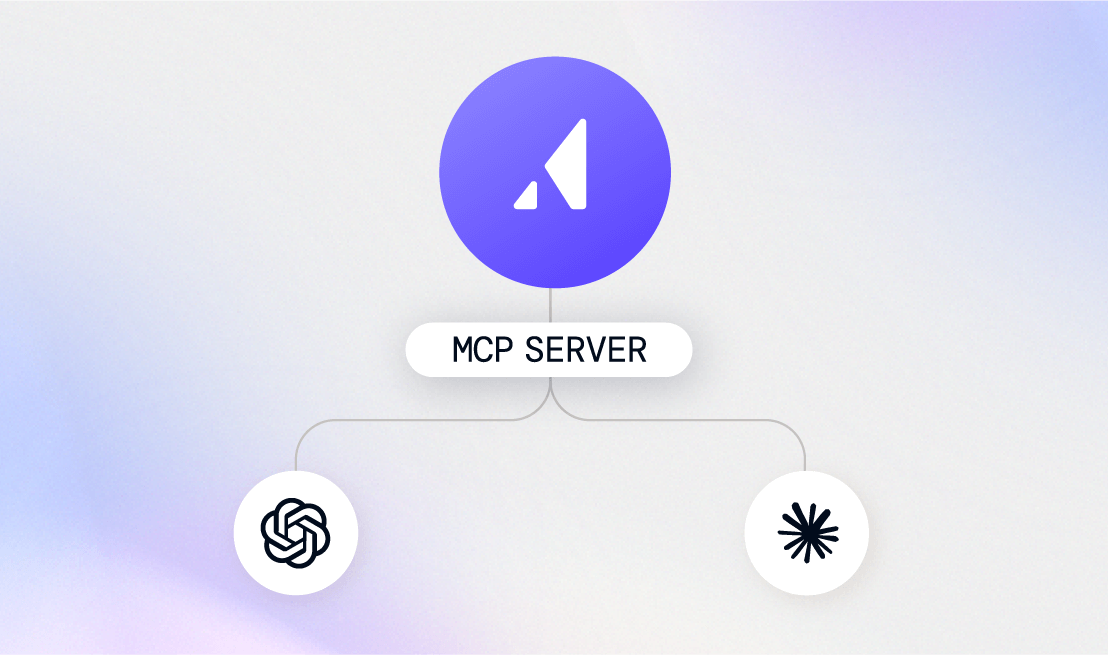
Connect experiences to broader strategy and results by using Appcues data in AI tools like ChatGPT or Claude, bringing real usage and performance into your analysis and planning.