.png)

In a recent “Startup Chat” podcast, Steli Efti mentioned an encounter with another young SaaS CEO. Her company was doing well, hitting about $2-3 million in annual revenue. But when Steli asked her about churn, she was at a loss.
She could muster up a number, but she didn't know whether it was customer or revenue churn, or whether it was gross or net churn. If the successful CEO of a multi-million dollar company doesn't know what her churn is, we can't imagine what's going on at the product level.
“Churn” is a term that gets thrown around a lot, but not enough product managers know what it's tied to, and how to prevent it. Product managers know the importance of customer retention, but often pour all their efforts into working on features that will attract a significant customer base, leaving the retention part for later.
You can build all the best features and acquire thousands of customers, but your startup will never thrive if you can't keep any around. Your first and foremost responsibility is to focus on the most valuable features of your app and make them sticky. For that, you need to understand churn.
Think of churn as a hole in the bottom of a boat. The more customers you have, the bigger the boat. But even the biggest boat will struggle to keep afloat with a huge hole in its bottom.
For a subscription service, churn is the monthly percentage of your customers that stop paying for your product. But this seemingly elementary equation is often stuffed with additional numbers that convolute its meaning.
Annual contracts have to be accounted for, as well as upgrades, downgrades, and seasonal customers. Some debate about how to factor in free trialers, and others divide up their customer base into cohorts. In fact, 43 different churn formulas can be accounted for.
Here are the numbers that you should be looking at to get an understanding of your customer retention, and how to use those numbers to make data-backed product decisions.
There are two basic churn formulas:
Revenue churn is hugely useful for the business side of things. You can use it to quantify your overall customer value and see which are your most valuable customers. But looking at this churn number by itself can lead to some misleading conclusions.
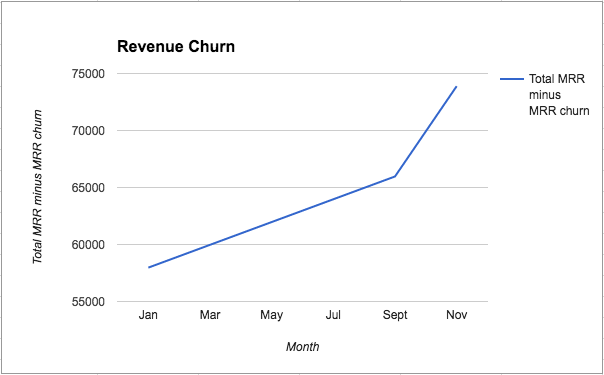
Say you offer a new upgrade in your app and it’s a huge hit— a whopping 30% of your customers upgrade, increasing your MRR. But, that month 6% of your customer base cancels their subscriptions. The revenue brought in through that upgrade will disguise the revenue lost from customer churn, masking an imminent problem that should be dealt with.
So here's what the numbers would look like if you only looked at revenue churn:
But if you look at customer churn, here's what you would see:
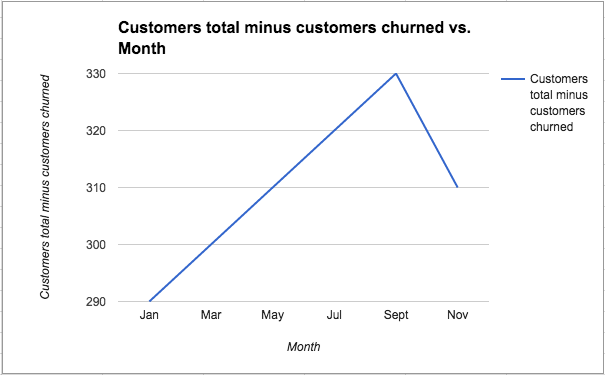
Looking solely at the revenue churn, a PM might give themselves a big pat on the back. They'll assume that their customer retention is exactly where it should be, when, in fact, these high monthly numbers don't translate into long-term retention. But looking at customer churn, they'll see that they're losing a higher percentage of customers than usual—going from 3% monthly churn to 6%.
So while revenue churn is certainly important, you can't afford to overlook customer churn. While having a few customers that are willing to spend more and more is great, getting a higher percentage of customers to stick around is even better.
Churn can be misleading in the short-term. Many startups actually have a low churn when they first launch, and it isn't until month 10 or 12 that they start seeing a dangerous spike.
The issue with app development is that customer churn can prove to be a super long and drawn out process. A customer might sign up for the app, immediately feel put off, but wait weeks, if not months, before actually unsubscribing or deleting the app. Alternatively, they might be hanging on by a loose thread, enticed by one feature in your app but overall dissatisfied. This is why you have to look not only at churn, but also at user engagement.
According to Brian Balfour, not enough people delve deep into their numbers. They see a high acquisition rate and pat themselves on the back, without looking at things like user engagement, and time spent in app.
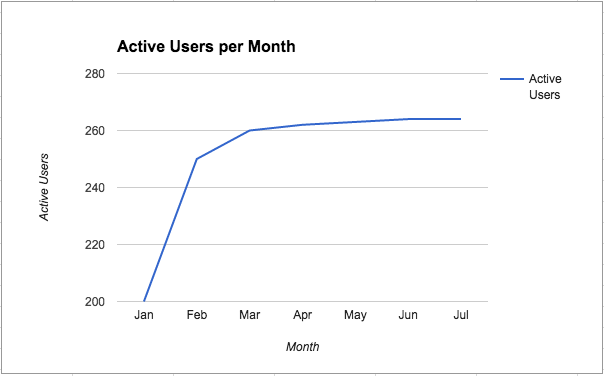
Let's take a look at an example. Say your customer retention looks pretty good:
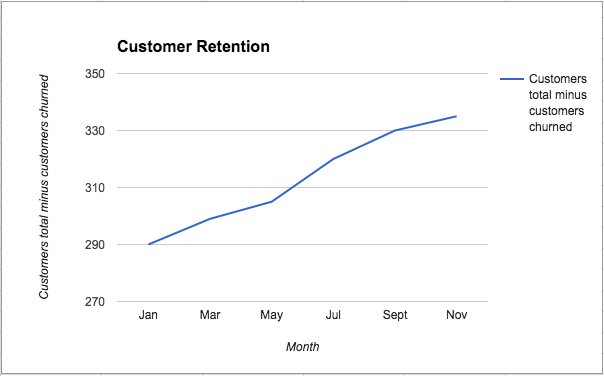
This is a really great trajectory for a new product. You're growing—but is this sustainable? Your current low churn percentage says yes.
According to Balfour, we should also be looking at user behavior. Let's take a closer look:
If you only looked at your customer churn rate, you would have completely missed this huge red flag. Despite the fact your signups are high, and your churn rate is low, your new users aren't active. They might open your app once in a while, and then exit out when asked to login. A plateauing in engagement means your growth isn't sustainable. Your churn number just doesn't reflect that yet.
It's only a matter of time before they churn, and your product plummets. So your customer retention graph will eventually look like this:
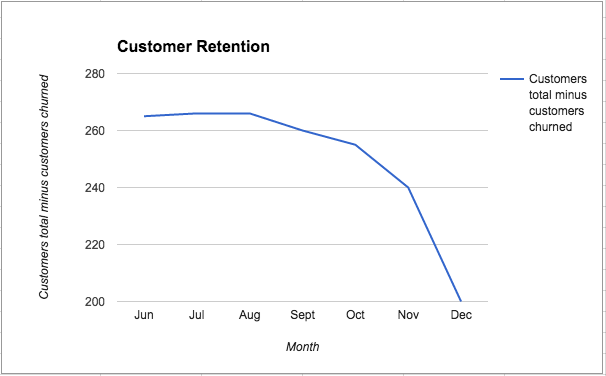
But you don't want to wait until you're on a downward trajectory to do anything about it. By taking a close look at customer engagement, you'll be able to find the disengaged customers before they churn.
Here are metrics that you should be using to get an idea of whether you'll retain these users:
In the “Startup Chat” podcast, Hiten Shah gives an example from his marketing analytics company, Kissmetrics. They looked at engagement after onboarding, and realized that low engagement in this early period meant that those people were likely to churn within 90 days.
When they built a 90 day roadmap, they were able to engage more of their early phase customers, effectively reducing churn by 2 percentage points.
Product managers have a lot of numbers to deal with, and it's tempting to pick the good ones and ignore the rest. But unlike the sales team, you don't have to convince anyone you're doing a good job. You want to actively look for and focus on the scary numbers (the high churn areas) to constantly improve the app.
The trick is to track users' engagement with different parts of your app. Then, you can figure out which features are less sticky and contribute the most to churn.
HubSpot was one company that had to recover from dangerously high churn—and they were only able to do so by looking into users' engagement with their different features.
According to a Harvard Business Review case study, HubSpot separated users into several groups:
They found that the highest churn was among customers who didn't install any features (9.9%). They also found that the second highest churn was for those who used only the analytics feature (4%), and the lowest was for customers who took advantage of all three of their features.
With this information, they were able to double down on their analytics feature, and focus their efforts on getting users engaged with all their features instead of just one. Such tenacity and attention-to-detail not only saved HubSpot, but helped it become the multi-billion dollar company it is today.
One number is never enough to inform a product decision. As a product manager, you want to look deeper and analyze big numbers with scrutiny. A high churn tells you that something went wrong in the user experience—that could be during onboarding, in the early, middle, or late stage of a customer time using your app— seconds, days, or months before they unsubscribed
But if you're careful with how you look at churn and what metrics you use to supplement your understanding of customer retention, not only will you get more customers to stick around, but you'll achieve sustainable growth that will propel your product into greatness.